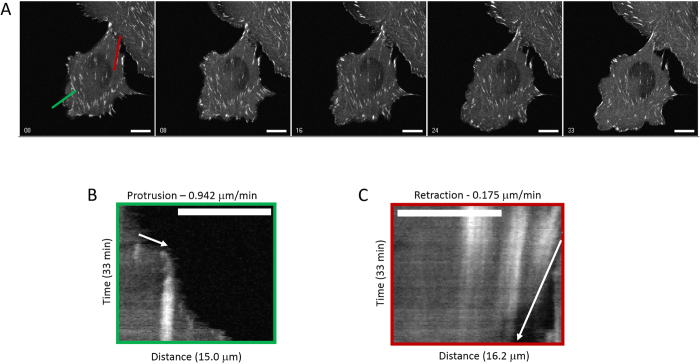
Figure 6. Cell protrusion and retraction rates measured using kymographs.
CHO-K1 cells expressing paxillin-EGFP were imaged 100 times with continuous exposures to 1% laser power from the 488 nm laser line with single slow scans or 16 rapid scans. Cells were then imaged every 20 seconds for 33 minutes with low laser power. (A) Kymographs of intensity versus time were generated along protruding (green line) or retracting (red line) regions of the cell. (B) Intensity versus time Kymograph of cell protrusion along the green line shown in (A). (C) Intensity versus time Kymograph of cell retraction along the red line shown in A. Scale bars are 10 μm.

