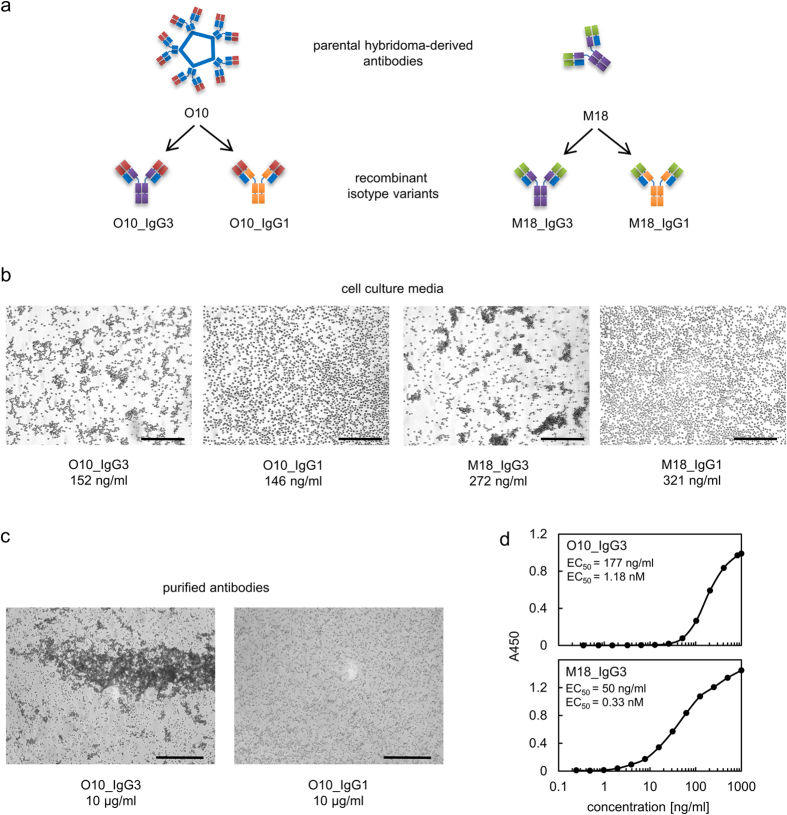
Figure 2. Haemagglutination induced by mouse IgG3.
(a) The drawing schematically presents cloning of variable fragments into IgG3 and IgG1 frameworks. (b) IgG1 and IgG3 with the same variable fragments were compared in terms of their ability to agglutinate erythrocytes. Antibody concentration in the analysed cell culture media was determined using ELISA. Representative results of three independent experiments. Scale bar –100 μm. (c) Since O10_IgG3 was less efficient in haemagglutination than M18, the experiment presented in b was repeated using higher concentration of purified O10_IgG3 and O10_IgG1 antibodies. Representative results of two independent experiments. Scale bar –200 μm. (d) The EC50 of antibody binding to immobilized type B RBCs. Data points represent mean values obtained for triplicates of analysed samples. The experiment was performed two times. The EC50 of M18_IgG3 was approximately three times lower than the EC50 of O10_IgG3 in both repetitions.

