
Figure 1. Ordination plot of samples from 33 women shows a distinct clustering pattern of different sample types (breast tissue, breast skin tissue, skin swab and buccal swab).
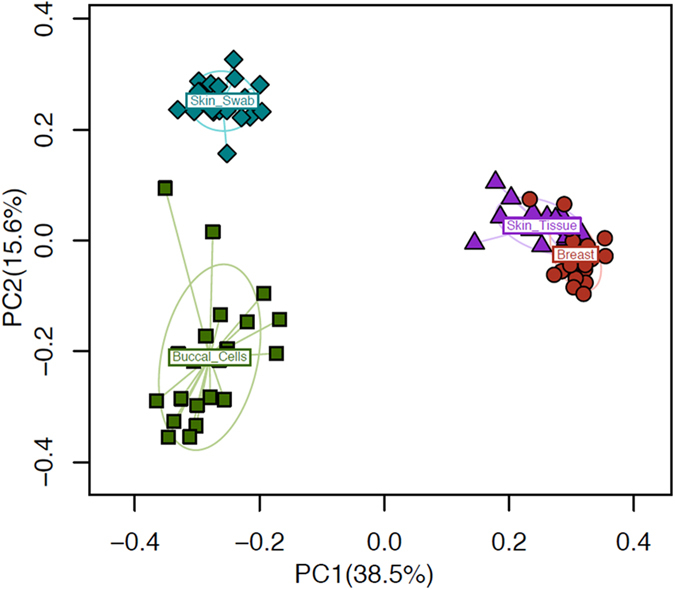
The microbiota samples are embedded in the two-dimensional space based on the first two principal coordinates (PCs) from PCoA on the unweighted UniFrac distance. The percentage of explained variability of each PC is indicated on the axis. Each point represents a sample and is colored by sample types (blue diamonds - skin swab, green squares - buccal swab, purple triangles - breast skin tissue, red circles - breast tissue). The ellipse reflects the probability distribution of each sample type.