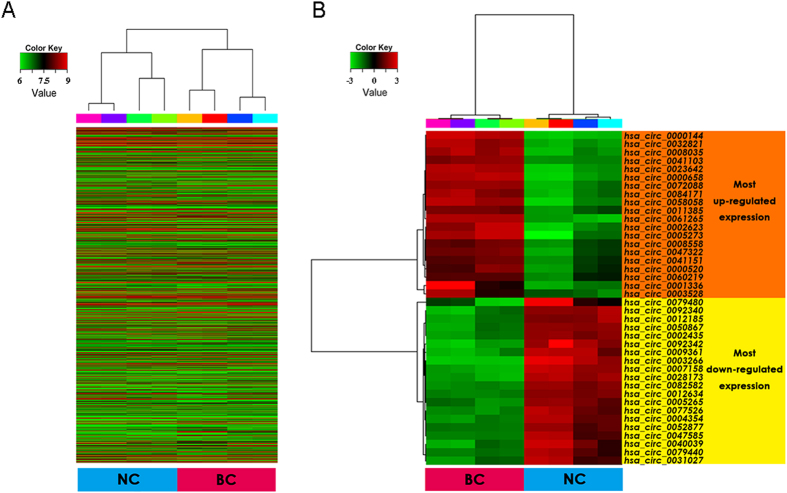
Figure 2. Heat map and hierarchical clustering showing expression values of all target circRNAs and the most up and down regulated circRNAs.
Each column represents a sample and each row represents a circRNA. Red strip represents high relative expression and green strip represents low relative expression. BC represents bladder cancer group, and NC represents normal control group. Each group contains four different samples. (A) Hierarchical cluster analysis of all target circRNAs. All target circRNAs mean entities where at least 4 out of 8 samples have flags in Present or Marginal. Flags are attributes that denote the quality of the entities using methods from GeneSpring software. (B) Hierarchical cluster analysis of the most up and down regulated circRNAs.

