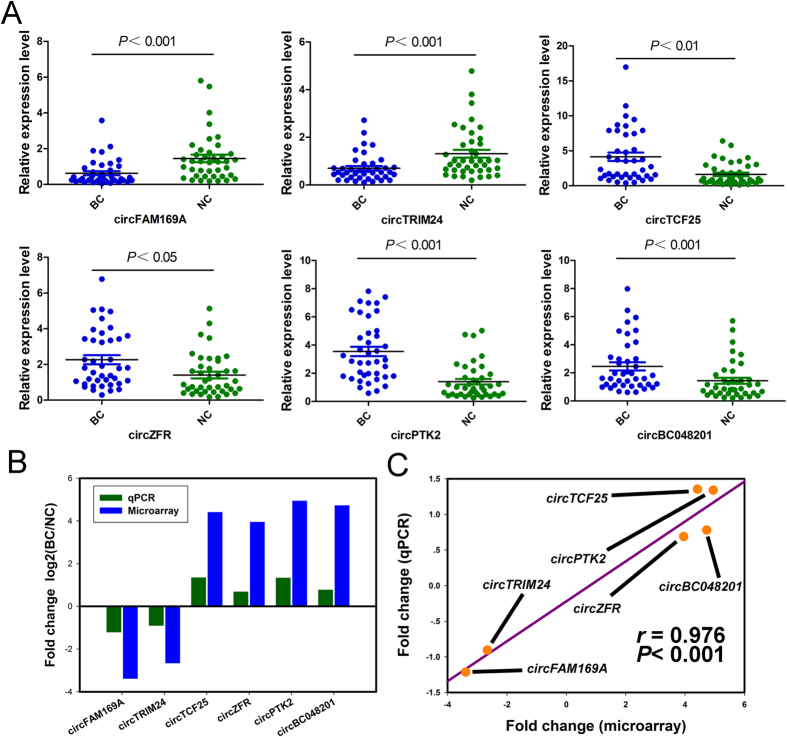
Figure 4. Quantitative real-time PCR validation for the expression of six circRNAs.
(A) The expression levels of six circRNAs were validated by qPCR in forty patients. BC, bladder cancer tissues. NC, normal control. Data are shown as mean ± SEM. (B) The comparison between microarray data and qPCR results. The vertical axis shows the mean of fold change (log2 transformed) of each circRNAs measured by qPCR and microarray respectively. (C) The qRT-PCR results matched well with the microarray data. Pairwise scatter plots are showed, comparing the fold changes (log2 transformed) of the microarray (horizontal axis) and the qPCR (vertical axis). The r stands for Pearson’s correlation coefficient (linear correlation coefficient).

