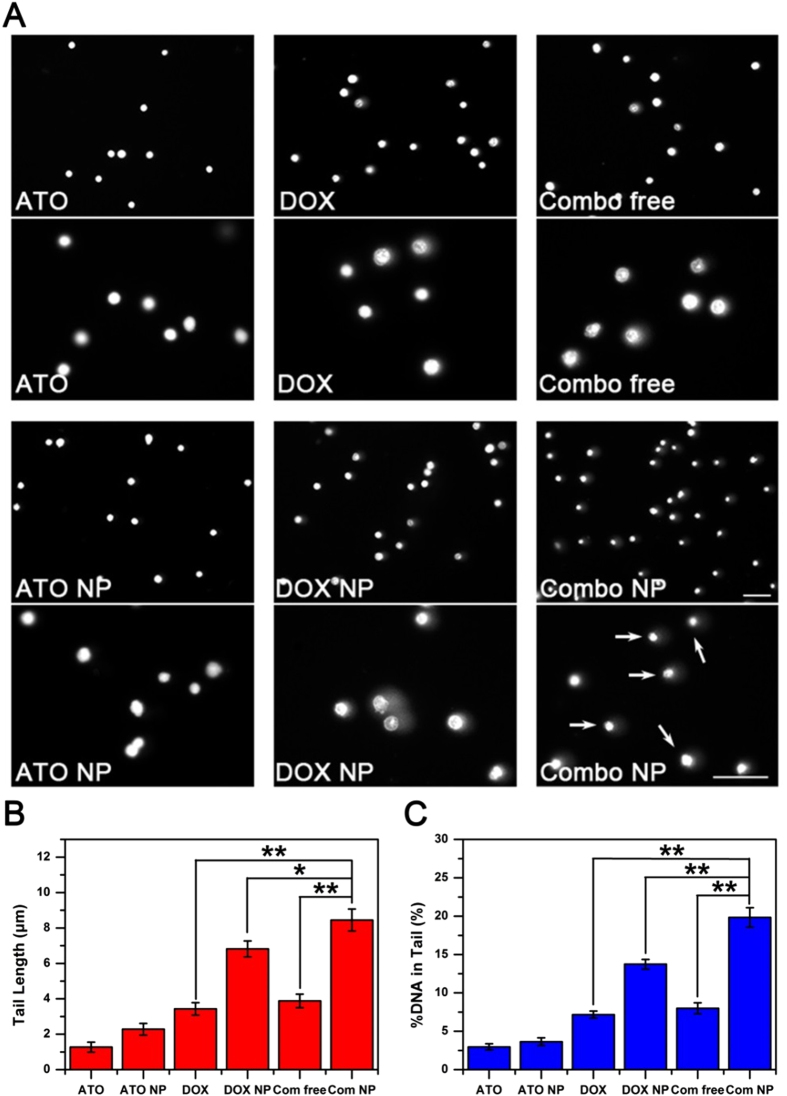
Figure 4. Comet assay for DNA damage.
(A) Fluorescence microscope imaging of HuH-7/ADM cells treated with different drug formulations (2 μM DOX and 4 μM ATO) for 12 h. The two pictures (upper and lower) were taken in the same experiment with different magnifications. DNA was stained by PI, scale bars: 50 μm. (B) Tail length and (C) percentage of DNA in tail were analyzed for 200 cells at random by CometScore software. All data are represented as average ± standard deviation (n = 3), *p < 0.05; **p < 0.01.

