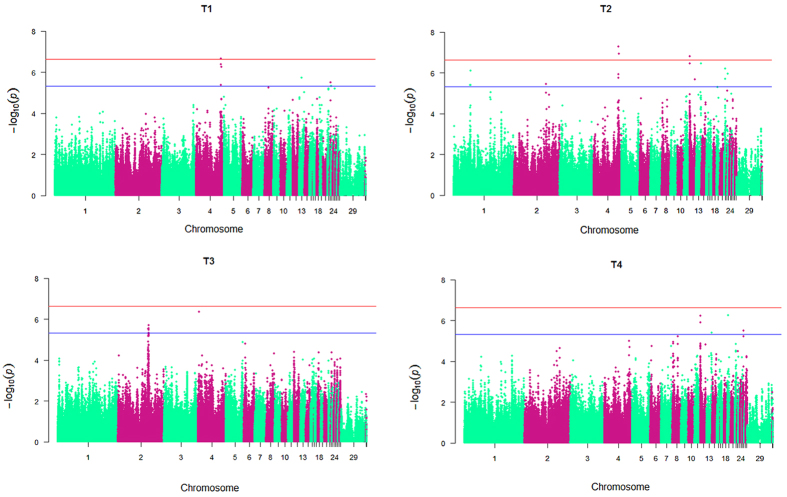
Figure 1. Manhattan plots of genome-wide association study on chicken aggressive-behaviour measured traits from T1 to T4 for all the SNPs.
The associated values (in terms of −log10P) are shown by chromosomes. The blue highlighted line indicates genome-wide association (P = 4.6E-6), and the red highlighted line indicates significance with a P-value threshold of the 5% Bonferroni genome-wide significance (P = 2.3E-7).

