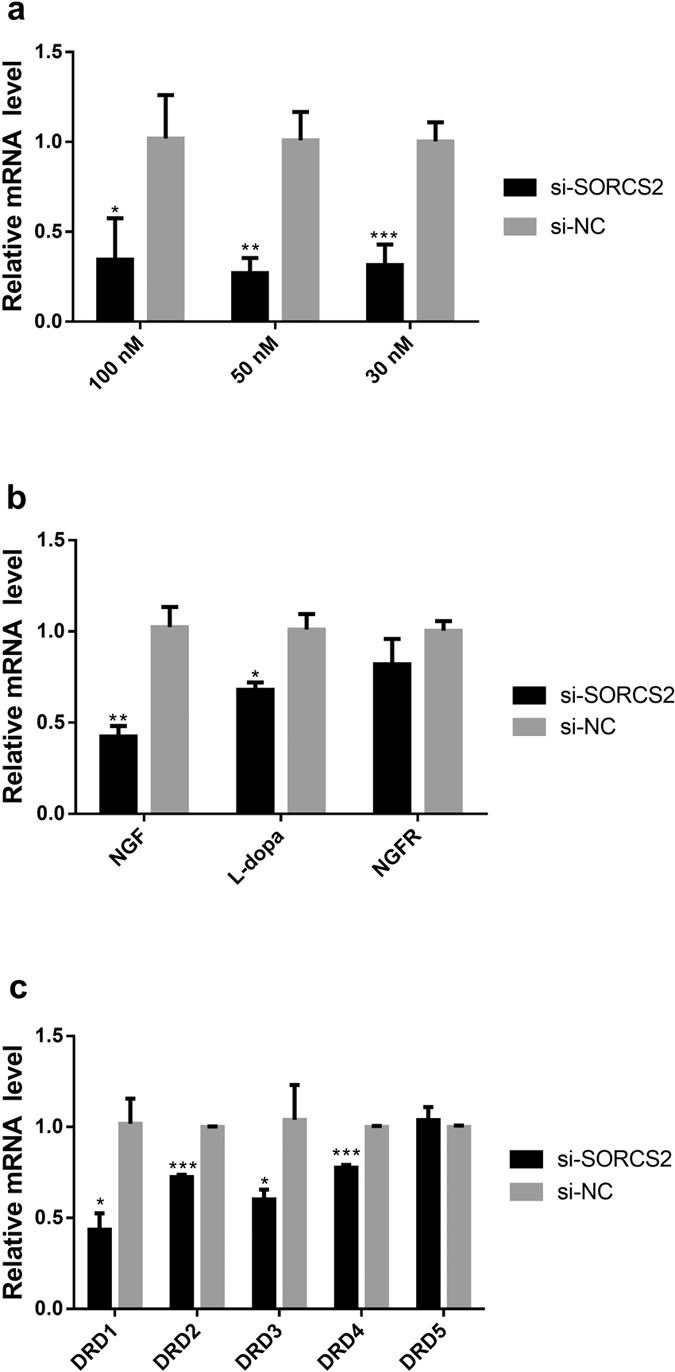
Figure 3. Expression levels of chicken SORCS2, NGF, NGFR, L-dopa and dopamine receptor family in SORCS2 knockdown DF-1 cells.

(a) In total, 100 nM, 50 nM, 30 nM of si-SORCS2 could significantly decrease SORCS2 expression levels in DF-1 cells at 48 h after transfection. (b) Knockdown of SORCS2 decreases the expression level of NGF, NGFR and L-dapa. (c) Knockdown of SORCS2 decreases the expression level of dopamine receptor family (DRD1, DRD2, DRD3 and DRD4). The levels of mRNA were measured by RT-qPCR analysis. In all panels, the levels of mRNA were measured by RT-qPCR analysis. Quantitative expressions of the data are presented as means ± S.E.M of at least three biological replicates. *, **, and *** indicate P-value significance at the threshold levels of 0.05, 0.01 and 0.001, respectively.
