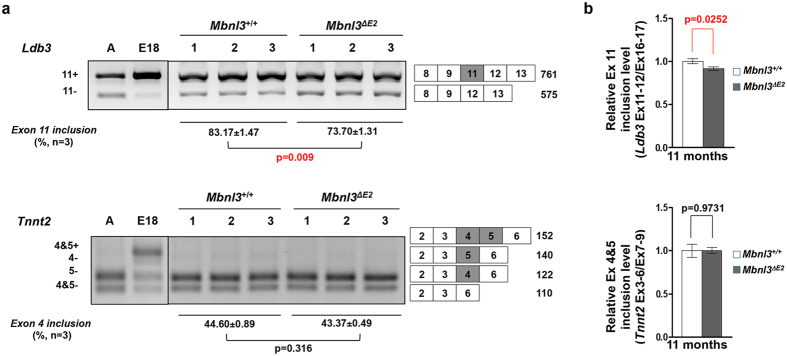
Figure 4. Ldb3 is aberrantly spliced in Mbnl3ΔE2 hearts.
(a) Alternative splicing was analyzed for Ldb3 and Tnnt2 in 11 months male Mbnl3+/+ (n = 3) and 11 month male Mbnl3ΔE2 (n = 3) hearts by RT-PCR. Band intensities were quantified by densitometry. Ldb3 exon 11 inclusion in Mbnl3ΔE2 was significantly decreased when compared to Mbnl3+/+ hearts. Tnnt2 exon 4 + 5 inclusion was not significantly different in Mbnl3+/+ and Mbnl3ΔE2 hearts. Exon numbers and expected band sizes are indicated. The alternatively spliced exon is shown as a gray box. Exon numbers are annotated based on Refseq from UCSC genome browser (NCBI37/mm9). Data are standard error of mean. (b) Expression levels of the alternatively spliced and the constitutive exons of Ldb3 andTnnt2 were quantitated by qPCR using exon-exon boundary spanning primers specific to Ldb3 exon 11 (exons 11–12), and Tnnt2 exon 4 + 5 (exon 3–6) and the constitutive exons (exon 16–17 for Ldb3; exon 7–9 for Tnnt2). Expression levels of each alternatively spliced exon was normalized to that of the corresponding constitutive exon. Relative Ldb3 exon 11 inclusion in Mbnl3ΔE2 hearts is significantly decreased when compared to Mbnl3+/+ hearts. Relative Tnnt2 exon 4 + 5 inclusion is not significantly different in Mbnl3+/+ and Mbnl3ΔE2 hearts. Data are standard error of mean (n = 3 mice for each genotype, each sample was repeated in triplicate).

