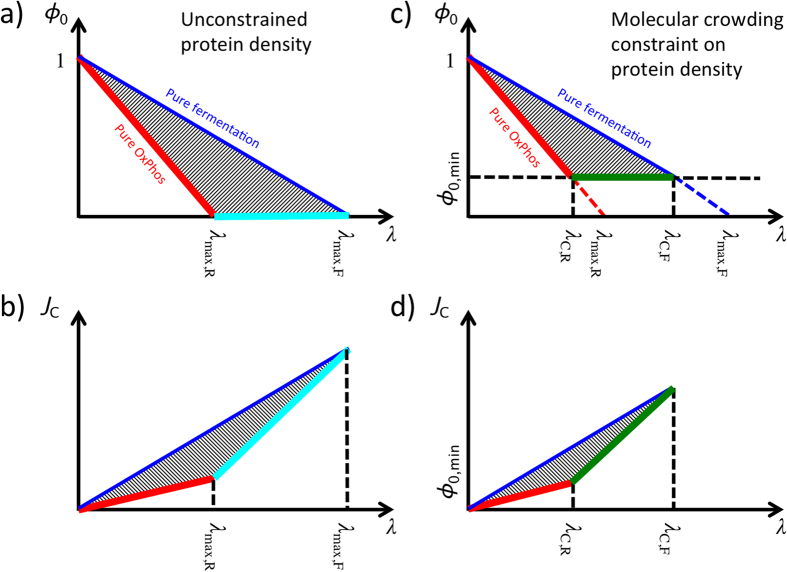
Figure 1. Solution space of the simplified model of Basan et al.11.
The red line represents the solution with pure OxPhos. The blue line represents the solution with pure fermentation. The dashed area represents solutions with mixed OxPhos/fermentation. The thick lines correspond with the optimal solution minimizing carbon uptake as a function of the proliferation rate, which is discussed in the main text. There are no feasible solutions in the white background outside the triangle. (a,b) Solution space when neglecting molecular crowding. The cyan line represents the optimal solution with mixed OxPhos/fermentation. (c,d) Solution space when accounting for molecular crowding. The green line represents the optimal solution with mixed OxPhos/fermentation. λmax,R and λmax,F are the maximum growth rate determined by the autocatalytic nature of the biosynthetic machinery taking into account the energy cost of biosynthesis, when the energy demand is satisfied by pure OxPhos and fermentation, respectively. λC,R and λC,F are the corrections to λmax,R and λmax,F, respectively, when there is a biomass fraction of non-metabolic proteins.

