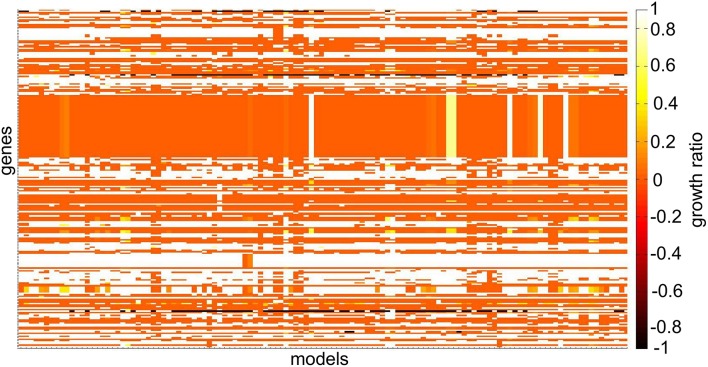
Figure 6.
Heat-map depicting differences in single gene deletion across 120 NCI-60 cell line models. The growth ratio is defined as the maximal objective value of the model divided by the maximal objective value of the model when the gene was deleted when optimizing for biomass production. Genes that were absent in individual models have a growth ratio value of –1. Genes that were absent in all models and genes whose deletion did not affect any model are not illustrated. The coloring in the heat-map corresponds to the maximal objective values obtained from flux balance analysis at each step of the analysis.

