Figure 8.
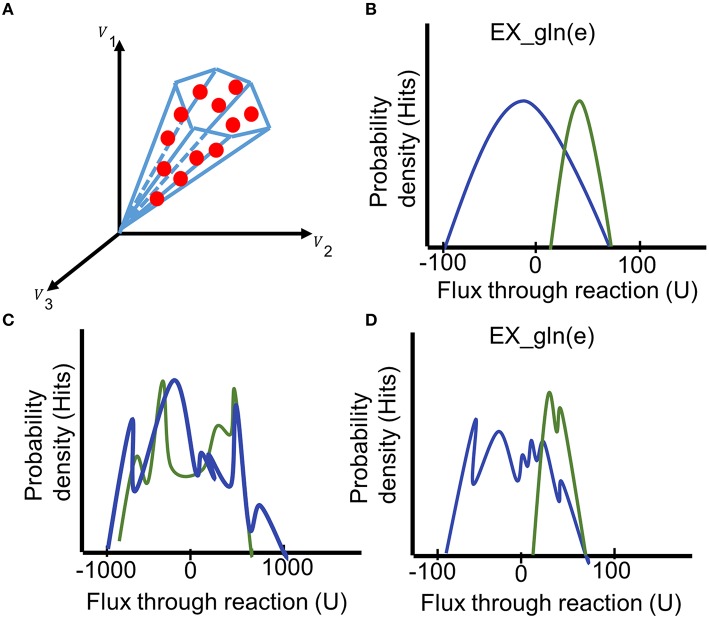
Interpreting the results of the sampling analysis. (A) During the sampling analysis, a large set of sampling points is collected (red dots, each comprising a flux distribution). The fluxes collected from the sampling points can be illustrated as probability distribution for individual reactions. (B) Comparing the histograms of the probability flux distributions through the glutamine exchange reaction in two models (blue and green) reveals a shift of the feasible steady-state solution space for this reaction. (C) The irregular histogram is typical for an unbounded reaction (distribution ranges from −1000 to 1000). (D) A premature flux distribution of the glutamine exchange reaction. Even though the final shape of the distributions can be guessed, additional sampling points need to be generated to get a unimodal distribution of the fluxes. Generation of additional points could shift the distribution. U = flux units.

