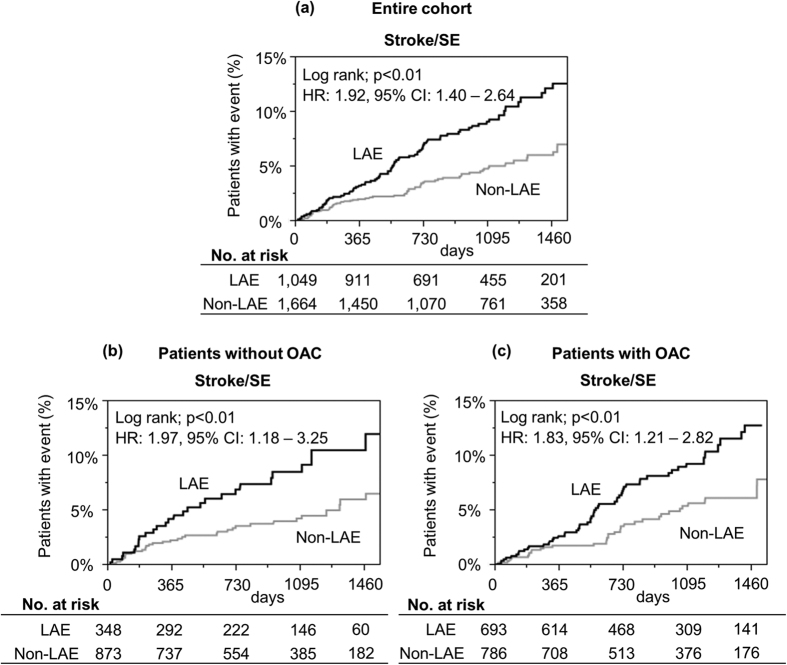
Figure 2. Kaplan-Meier curves for the incidence of stroke or systemic embolism (SE) during follow-up period.
(a) Entire cohort, (b) Patients without oral anticoagulant (OAC). (c) Patients with OAC at baseline. CI = confidence interval, HR = hazard ratio, LAE = left atrial enlargement, OAC = oral anticoagulant, SE = systemic embolism.

