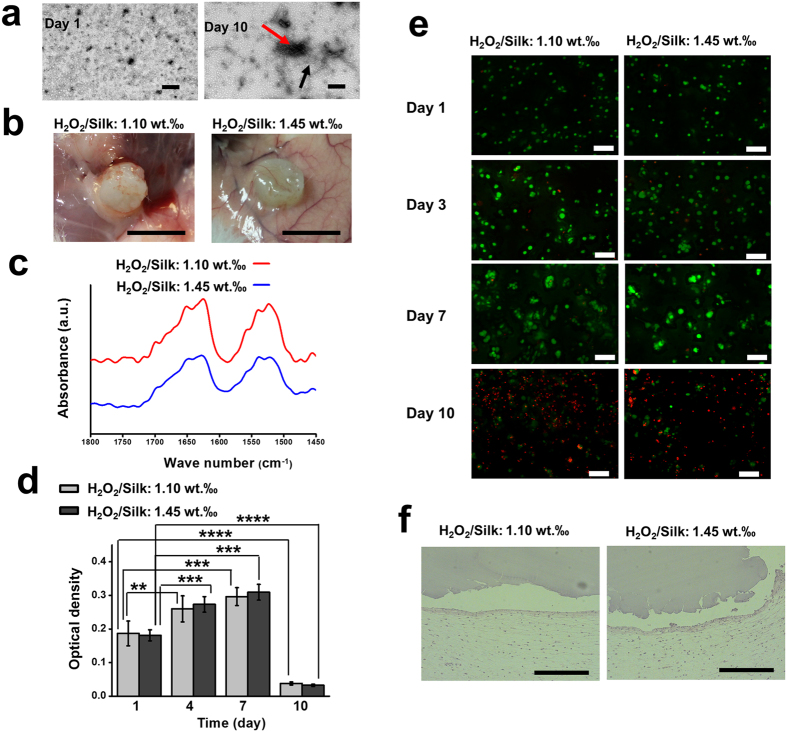
Figure 3. In vitro conformation evaluation and cell encapsulation studies and in vivo subcutaneous implantation for the SF hydrogels.
(a) SF hydrogel transmission electron micrographs after incubation in PBS at 37 °C for 1 (left) and 10 days (right). The black arrows indicate nanofibrils and the red arrows indicate nanofibrils aggregates (Scale bar:200 nm). (b) Macroscopic images of explants retrieved after 2 weeks of subcutaneous implantation (scale bar: 5 mm). (c) SF hydrogel ATR-FTIR spectra after 2 weeks of implantation. SF solution: 16 wt. %; Silk/HRP: 0.26‰ (wt/wt). (d) Cell viability after encapsulation analyzed by MTS assay (n = 9). (e) Live/dead staining for the ATDC-5 cells whithin the SF hydrogels from 1 to 10 days (scale bar: 100 μm). (f) H&E staining of the explants (scale bar: 400 μm). **P < 0.01, ***P < 0.001, ****P < 0.0001.

