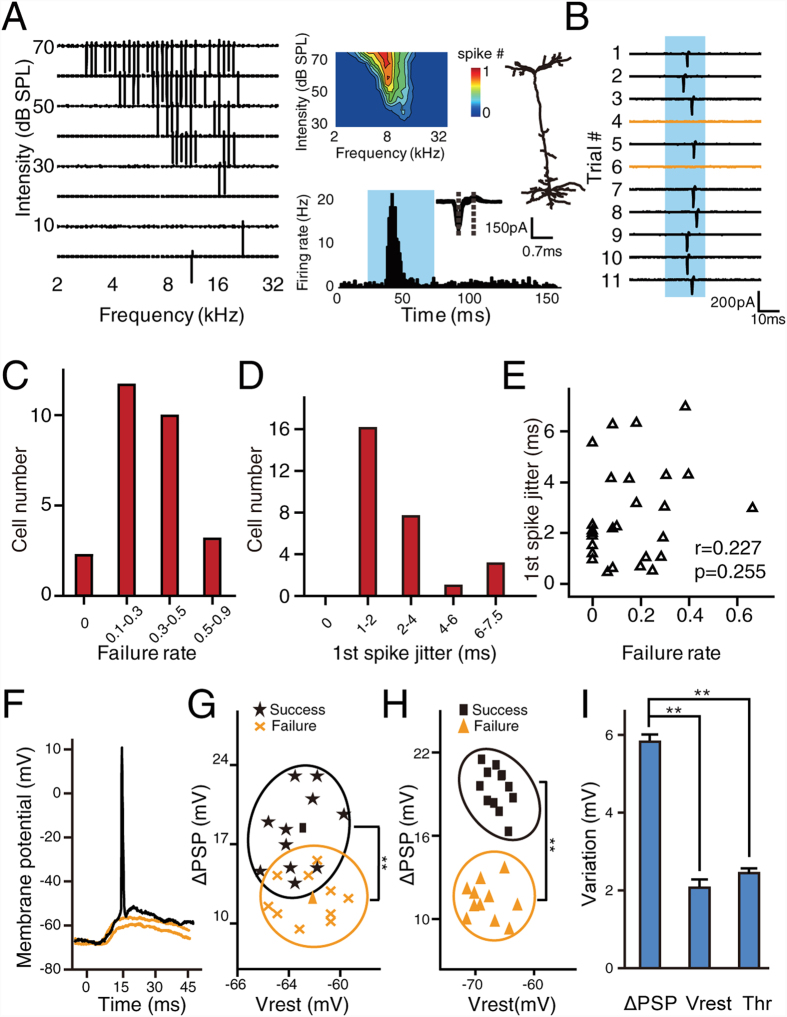
Figure 1. Supra- and subthreshold spike variation of excitatory neurons in A1.
(A) A representative TRF recorded from an excitatory neuron in A1. Left, raw spike TRF from one trial. Each small trace in the TRF represents the evoked spike response (50 ms window) to a pure tone. Right, TRF of the averaged spike response and cell morphology as reconstructed by biocytin histology (upper), peristimulus time histogram (lower, bin = 1 ms), and superimposed spike waveforms (inset, n = 50, randomly chosen). The shaded area indicates the presence of the pure tones. The dashed lines indicate the trough-to-peak interval. (B) Spike responses to pure tones at CF (20 dB above threshold) that were recorded over 11 repetitions. The yellow line indicates trials failed to generate spikes. The shaded area indicates the presence of stimuli. (C) The distribution of response FR to repetitive pure tones at CF (20 dB above threshold) from 27 excitatory neurons. (D) The distribution of 1st spike jitter to repetitive pure tones at CF (20 dB above threshold) from 27 excitatory neurons. (E) Scatter plot of FR versus 1st spike jitter (n = 27 neurons). r, Pearson correlation coefficient. p, correlation significance. (F) Three examples of membrane potential response to repetitive pure tones (CF, 20 dB above threshold). The yellow line indicates trials failed to generate spikes. The stimulation starts at 0 ms with a duration of 35 ms. (G) Scatter plot of ΔPSP versus resting membrane potential for responses with and without spikes (21 trials). The clustering is based on spike responses. Black cluster, successful spike; Yellow cluster, failed spike. The square and triangle indicate the average value for successful spikes and failed spikes, respectively. **p<0.01, t-test. (H) Scatter plot of the average ΔPSP versus the average resting membrane potential from 11 recorded excitatory neurons. The ΔPSP and resting membrane potential were grouped based on whether the spike response was successful or failed. **p < 0.01, paired t-test. (I) Comparison between the variation of ΔPSP, resting membrane potential(Vrest) and threshold(Thr). n=11, **p < 0.01, one-way ANOVA and post hoc test. Error bar, S.E.M.

