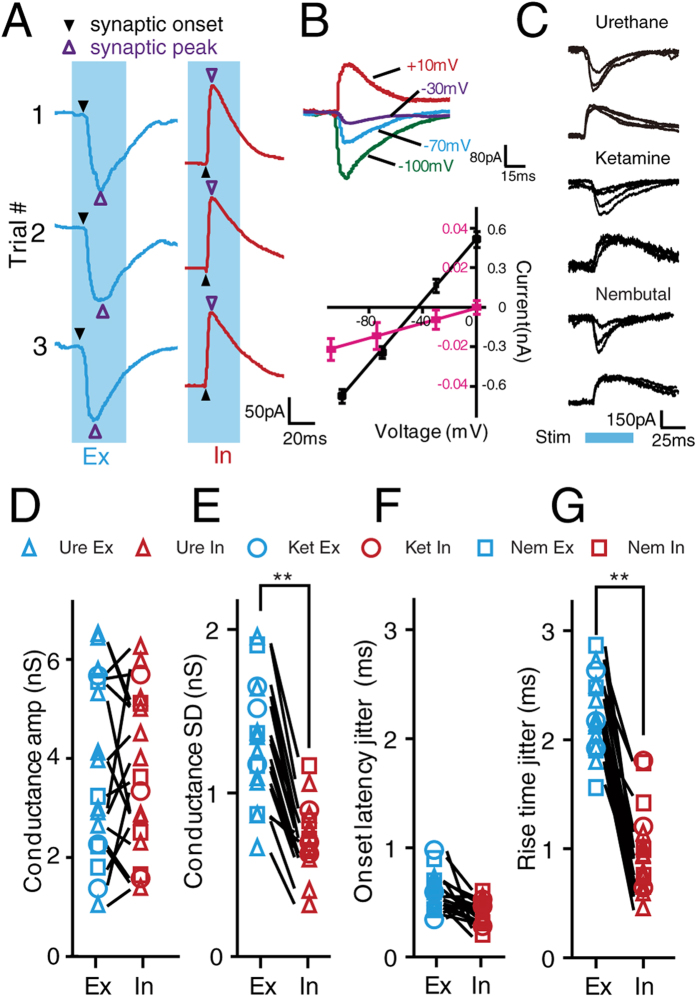
Figure 2. In vivo voltage-clamp recording of excitatory and inhibitory synaptic inputs.
(A) Example of excitatory (blue) and inhibitory (red) synaptic responses to repetitive pure tones (CF, 20 dB above threshold, 3 trials). The solid and open triangles indicate the onset and peak of the synaptic inputs, respectively. The shaded area indicates the presence of the pure tones. (B) Synaptic responses to white noise (60 dB) recorded at different holding potentials (Upper, −100, −70, −30, and +10 mV). Lower, I-V curves for synaptic currents averaged from 5 repeats. The curves were generated using values from within 0–1 ms (red) and 20–22 ms (black) windows after the onset of responses. Error bar, SEM. (C) Demonstration of excitatory and inhibitory synaptic inputs recorded under different anesthetic drugs. Shaded area indicates the presence of pure tone. (D,E) Comparison of the average amplitude (D) and standard deviation of amplitude (E) of excitatory and inhibitory conductance from 10 excitatory neurons. Data recorded from the same neuron are linked with a line. **p < 0.01, paired t-test. (F,G) Comparison of the onset latency jitter (F) and rise time jitter (G) of excitatory and inhibitory synaptic inputs. Data recorded from the same neuron are linked with a line. **p < 0.01, paired t-test. The combination of color (blue and red) and shape (triangle, circle, and square) indicate the excitatory and inhibitory synaptic inputs that were recorded under different anesthetic conditions. The statistical test were conducted using the data collected under urethane anesthesia (urethane, n = 10; ketamine+xylazine, n = 3; Nembutal, n = 4).

