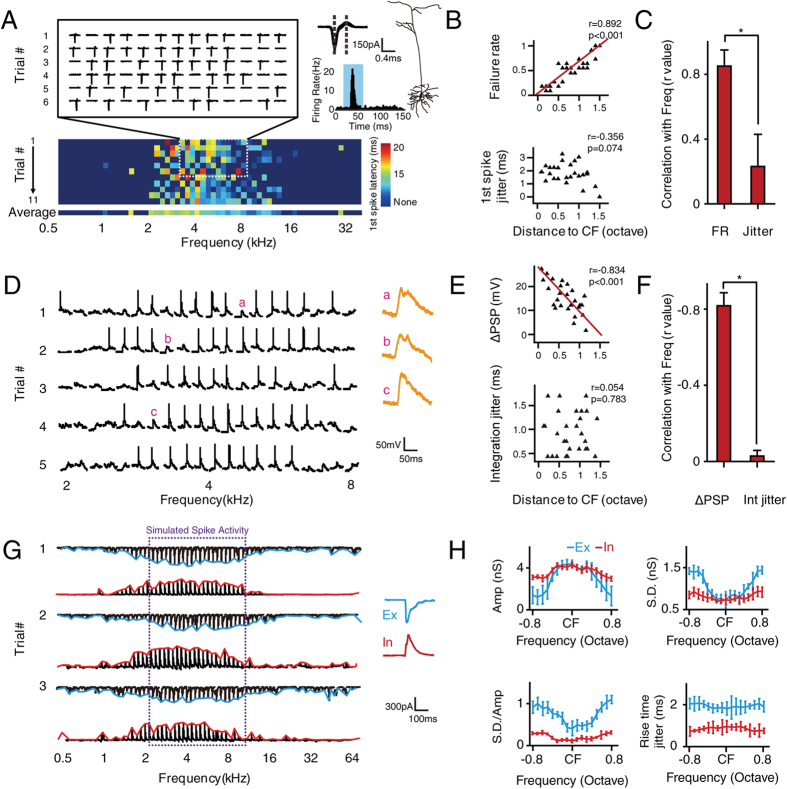
Figure 4. Synaptic mechanisms underlying the frequency selectivity of spike variation.
(A) Upper left, six trials of representative spike responses to pure tones within 1.3 octaves of CF (20 dB above threshold). Upper right, superimposed spike waveforms (n = 50, randomly chosen), cell morphology as reconstructed by biocytin histology, and the peristimulus time histogram of the recorded neuron (bin = 1 ms). Lower, 11 trials of spike responses to pure tones of various frequencies represented by first spike latency. Deep blue indicates no spike. The shaded area indicates the presence of stimuli. Dashed lines indicate the trough-to-peak interval. (B) Upper, scatter plot of the distance to CF versus FR. Lower, scatter plot of the distance to CF versus 1st spike jitter, based on statistics from the representative neuron shown in (A). (C) Pearson correlation coefficient measured between the FR, 1st spike jitter and the relative distance to CF (n = 12 neurons). Jitter, 1st spike jitter. Bar, S.D. *p = 0.0117, using Fisher’s Z-transformation. (D) Left, five trials of representative membrane potential responses to pure tones of various frequencies (20 dB above threshold). Right, three enlarged responses without spike. The scale bar is for traces on the left side. (E) Upper, scatter plot of the distance to CF versus ΔPSP. Lower, scatter plot of the distance to CF versus integration time jitter, based on statistics from the representative neuron shown in (D). (F) Pearson correlation coefficient measured between the ΔPSP, integration time jitter and the relative distance to CF (n = 7 neurons). Int jitter, integration time jitter. Bar, S.D. *p = 0.0409, using Fisher’s Z-transformation. (G) Left, three trials of representative excitatory and inhibitory responses to pure tones of various frequencies (20 dB above threshold). Right, averaged synaptic response to the CF. In, inhibitory input; Ex, excitatory input. The purple dashed lines show the region of simulated spike activity. (H) Frequency tuning of the excitatory and inhibitory conductance(Amp), variation of the conductance (S.D.), ratio between the variation and the amplitude(S.D./Amp) as well as the synaptic rise time jitter (n = 9). In, inhibitory conductance; Ex, excitatory conductance.

