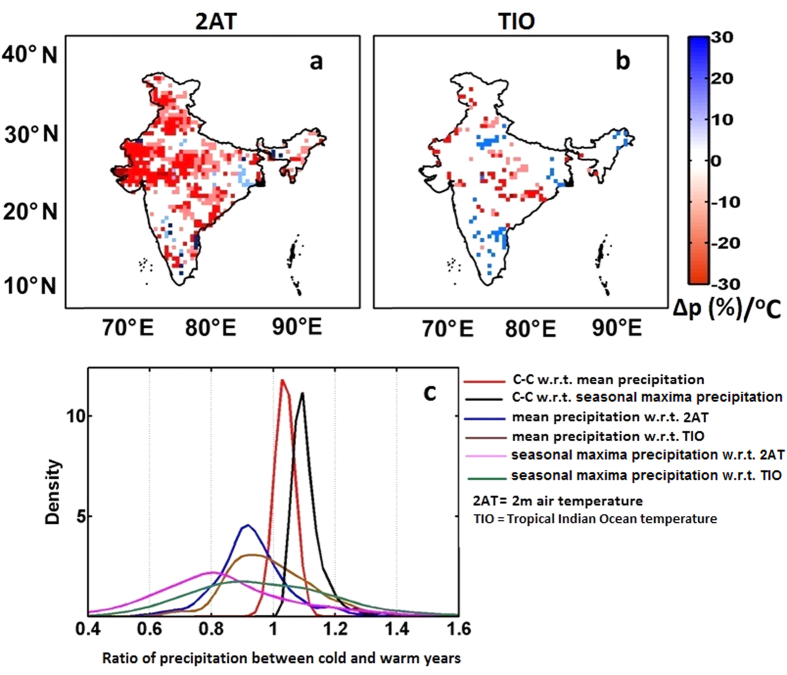
Figure 4.
Changes in precipitation extremes (∆p expressed in %) for per degree increase in (a) 2AT and (b) TIO. The colored grids indicate a significant association between precipitation extremes and temperature. In the case of 2AT, most of the grids depict a negative change in the precipitation per degree increase in temperature; however, in the case of TIO, the maximum grids show no significant association. The changes in precipitation, both in its mean and extremes, are compared with the C-C scaling. (c) Here, the nonparametric kernel PDF of the ratio between hot to cold years by considering all the grids over India are plotted. The C-C scaling for both mean and extreme precipitation overestimates the changes when compared with the observed mean and extreme precipitation ratio. The maps are developed in ArcGIS 10.1 (http://www.esri.com/software/arcgis) and PDFs are generated using MATLAB (http://www.mathworks.com).

