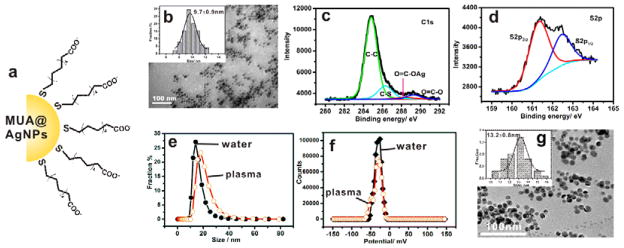
Figure 1. Characterization of MUA@AgNPs.
(a) Cartoon depiction of the negatively charged MUA@AgNPs. (b) Transmission electron microscopic (TEM) image and the size distribution of MUA@AgNPs in water. (c and d) High-resolution XPS spectra of C1s and S2p at room temperature. (e and f) Hydrated size and zeta potential of MUA@AgNPs in distilled water and mouse plasma as indicated. (g) TEM image and the size distribution of MUA@AgNPs in mouse plasma.

