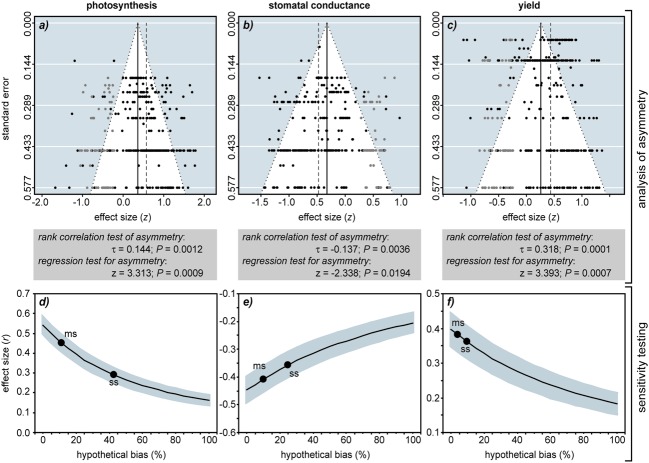
FIGURE 2.
The impact of reporting bias on the outcome of meta-analysis of the effect of FACE on C3 herbaceous plants. All articles were peer-reviewed and listed within the ISI Web of Knowledge. Funnel plots of photosynthesis (n = 265) (a), stomatal conductance (n = 243) (b) and yield (n = 302) (c) show the distribution of data. Data from the studies used in the meta-analysis is represented by solid black circles. To balance asymmetry in the funnel plot the trim and fill method (Duval and Tweedie, 2000) uses the existing data to impute estimated ‘missing studies’ that are represented as gray symbols. The black solid vertical line indicates the mean effect size of the meta-analysis after the trim and fill. The dashed vertical line indicates the mean effect size computed by the meta-analysis before the ‘missing studies’ were imputed. The difference between the black solid line and dashed vertical line represents the effect of reporting bias on effect size as indicated by the trim and fill method. The gray box below the funnel plot shows the Begg – Mazumdar (Begg and Mazumdar, 1994) rank correlation coefficient using Kendall’s τ and Egger’s regression test (Egger et al., 1997) to assess the probability of publication bias within the datasets. To gage the impact of hypothetical publication bias in the literature on the meta-analysis of photosynthesis (d), stomatal conductance (e) and yield (f) we included increasing numbers of studies with randomly generated small effect sizes (r) of -0.1 to 0.1 (Cohen, 1992). The black solid line indicates the mean effect size for the meta-analysis and the gray shading either side represents 95% confidence intervals. Solid circles indicate the points where moderate (labeled ms) and severe (labeled ss) selection calculated using the model of Vevea and Woods (2005) would occur.

