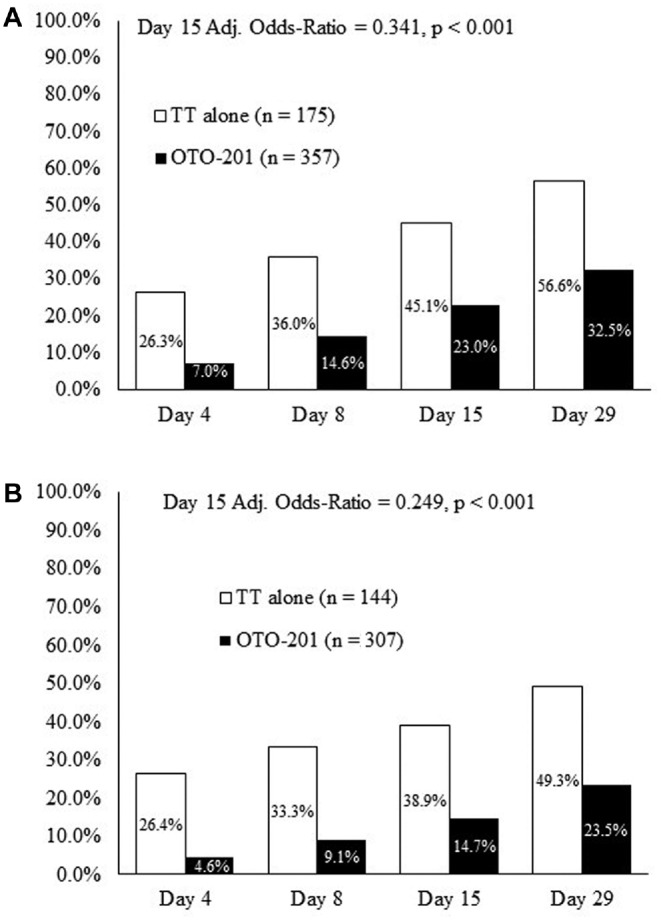
Figure 2.

Cumulative proportion of treatment failures at day 15 (patients, %). (a) Intent-to-treat population (day 15, primary end point; days 4, 8, and 29, secondary efficacy end points). (b) Per-protocol population (sensitivity analysis). TT, tympanostomy tube.
