
Fig. 1.
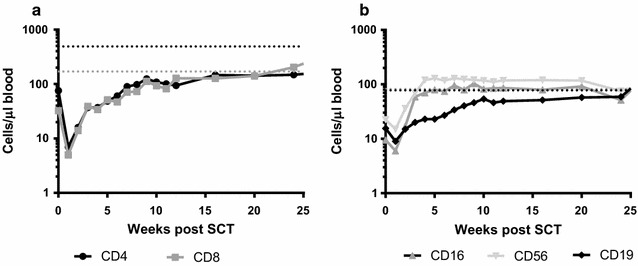
Reconstitution dynamics for the whole patient population. Absolute cell counts were determined weekly during the first 12 weeks and thereafter at a monthly basis. In (a) the median value for CD4+ and CD8+ T cells are plotted per time point. Lower normal values for healthy controls, based on Jentsch-Ullrich et al. (Clin Immunol 2005) and Comans-Bitter et al. (J Pediatr 1997), are depicted with a dashed line. Similarly, in (b) the median value for CD16+ and CD56+ NK cells, as well as CD19+ B cells are plotted per time point