
Fig 2.
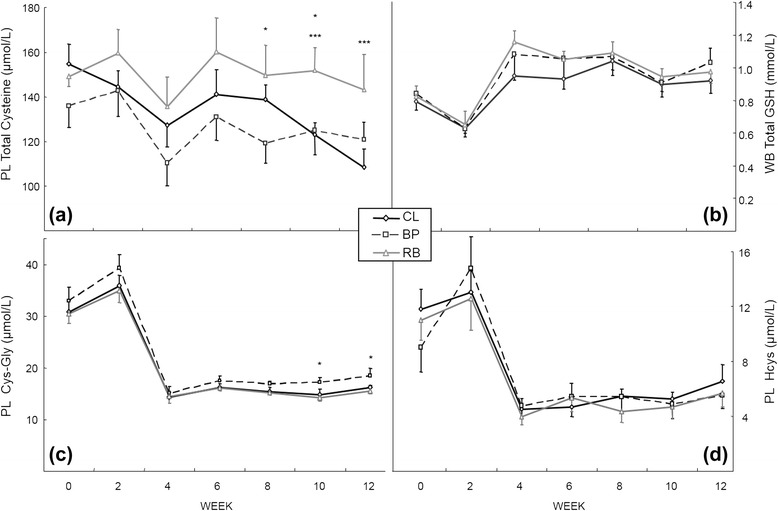
Various thiol concentrations in plasma (PL) and whole blood (WB) of the dogs fed the purified diets containing various fiber sources. a PL total cysteine (free + bound); b WB total glutathione (GSH + GSSG); c PL cysteinyl-glycine; d PL homocysteine. The values are expressed as mean ± SEM. The symbols represent the groups that have significant different (P < 0.05 unless otherwise mentioned in the text) at the time point (*significance between BP and RB and ***significance between RB and CL). From week 10, n = 5 for the BP group due to omission of one dog for excessive weight loss