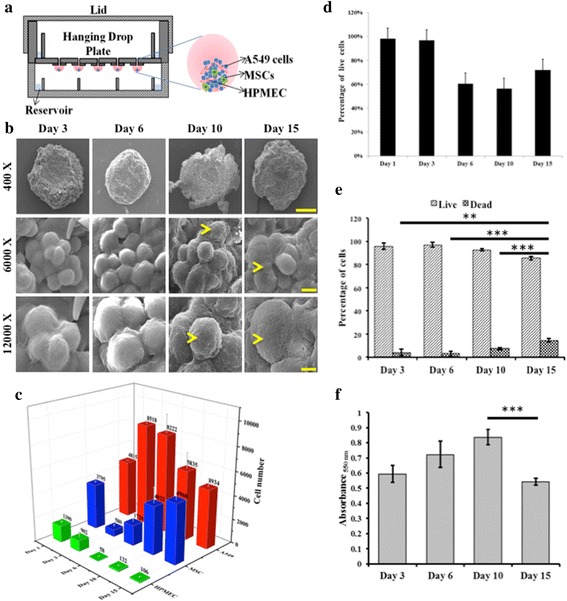
Fig. 1.

a Schematic representation of synthetic tumor microenvironment mimic (STEM) generation using the hanging drop method, b Scanning electron micrographs of STEMs at the end of day 3, 6, 10, and 15 (Scale bar 400 X: 200 μm, 6000 X: 10 μm, and 12000 X: 5 μm), c Temporal changes to the cellular compositon of the STEMs as determined by FACS (n = 3), d Fraction of live and dead cells in the STEMs as function of time as assessed by fluorescence activated cell sorting experiment (FACS, n = 3), e Percentage of live/dead cells as determined by Trypan blue staining (** indicates significance (p < 0.01) between day 3 and day 15, and *** indicates sigificance (p < 0.001) between day 6 and day 15; and day 10 and day 15). Statistical analysis depicts comparison between the dead populations on each day. f Metabolic actitvity (MTT assay) of STEMs as a function (*** indicates (p < 0.005) between day 10 and day 15)
