
Fig. 3.
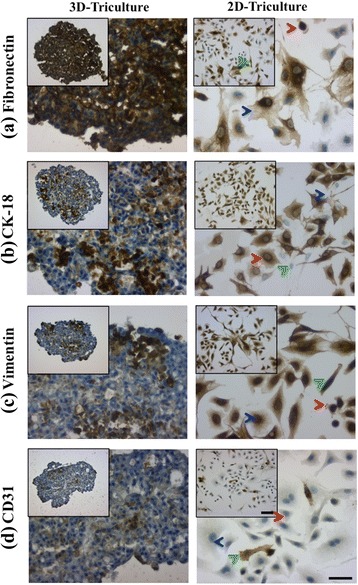
Immunohistochemical staining of STEM cryo-sections at day 15 (left panel): (a) fibronectin, (b) CK-18, (c) vimentin, and (d) CD-31, and (right panel) 2-D tri-culture controls. A549 population indicated by red arrowhead, HPMEC population indicated by green arrowhead, and MSC population indicated by blue arrowhead. Scale bar for low magnification images – 100 μm, scale bar for inset – 50 μm. Negative controls are shown in Additional file 1: Figure S1