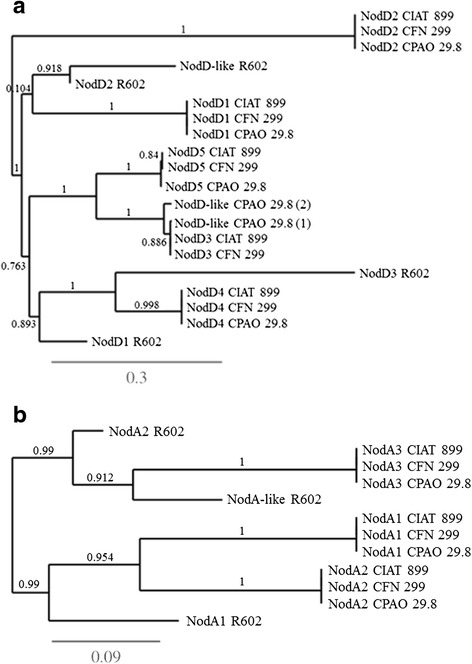
Fig. 6.

a Phylogenetic tree of representatives nodD genes of R. leucaenae CFN 299T and CPAO 29.8, R. tropici CIAT 899T and R. gallicum R602T. The branches length represents the evolutionary lineages changing over time. The length of the brach represents the amount of changes and it is proportional to the number of nucleotide substitutions per site. The bar at the bottom of the figure provides a scale for the evolution. b Phylogenetic tree of the three copies of nodA genes of R. leucaenae CFN 299T and CPAO 29.8, R. tropici CIAT 899T and the two nodA copies and a third nodA-like of R. gallicum R602T. The branches length represents the evolutionary lineages changing over time. The length of the brach represents the amount of changes and it is proportional to the number of nucleotide substitutions per site. The bar at the bottom of the figure provides a scale for the evolution
