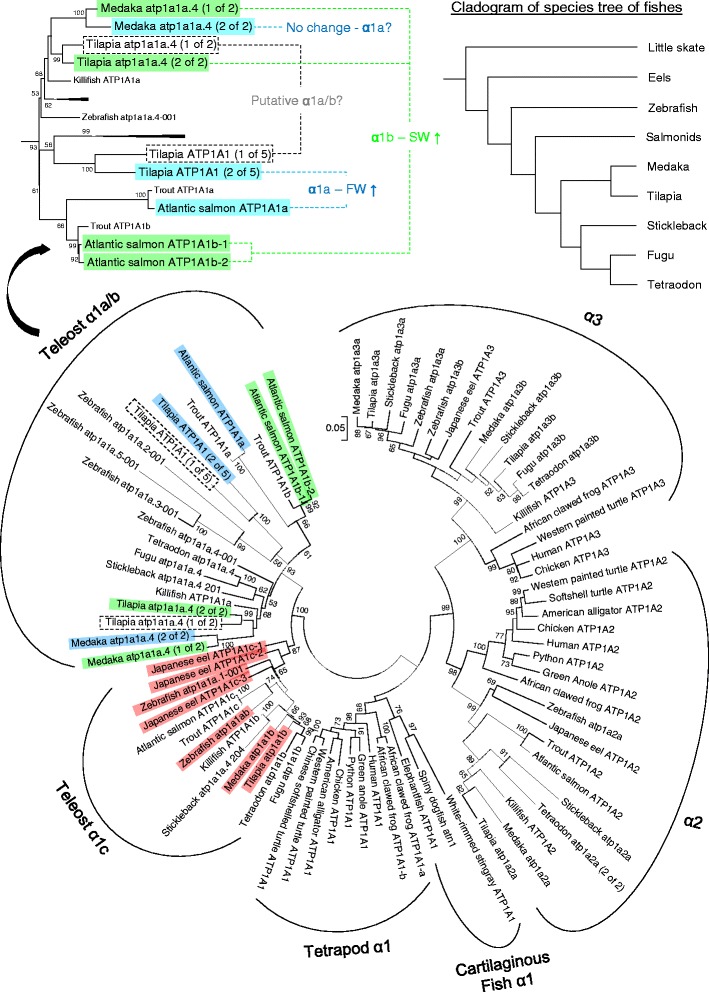
Fig. 1.

Phylogenetic tree of representative vertebrate NKA α-subunits depicted by maximum likelihood method. The deduced proteins of NKA α-subunits from prediction and cloned sequences are included in the analysis. Blue, green, and red highlights indicate the α1a, α1b, α1c isoforms respectively in Atlantic salmon, tilapia, medaka, and eel with quantitative real time PCR data from literatures. Dashed boxes indicate putative α1a/b that have not been characterized in tilapia. The top left panel shows the enlarged α1a/b clade in teleost to indicate the paraphyletic relationship among known α1a and α1b in known species. The top right panel shows a cladogram of contemporary species tree that indicates the phylogenetic relationship of the teleost representative used in this study (summarized from [24]). Each taxon is named with genome- or GenBank-annotated identity. Numbers on the branches are the bootstrap values of 1000 replicates. Scale bar represents 5 % amino acid substitution
