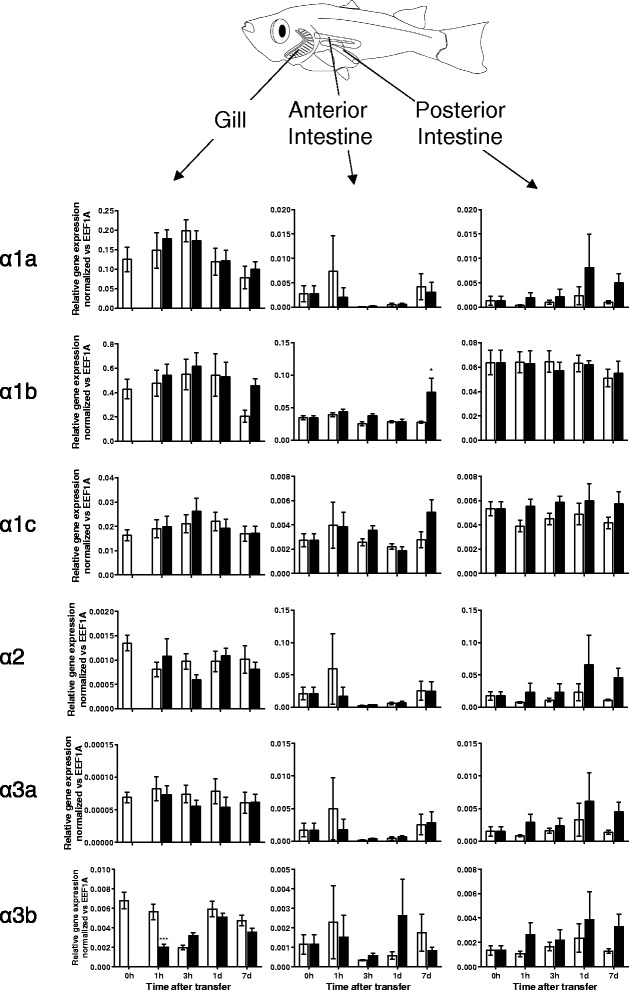
Fig. 5.

Relative gene expression of NKA α-subunit isoforms in gill and intestine (anterior and posterior) of Japanese medaka quantified by real time PCR (N = 6). Gene expression was normalized against that of eef1a in each tissue. Statistical significances between FW and SW groups within each time point were indicated by * (p < 0.05), ** (p < 0.01), and *** (p < 0.001) after tested by two way ANOVA, Tukey’s test
