
Fig. 1.
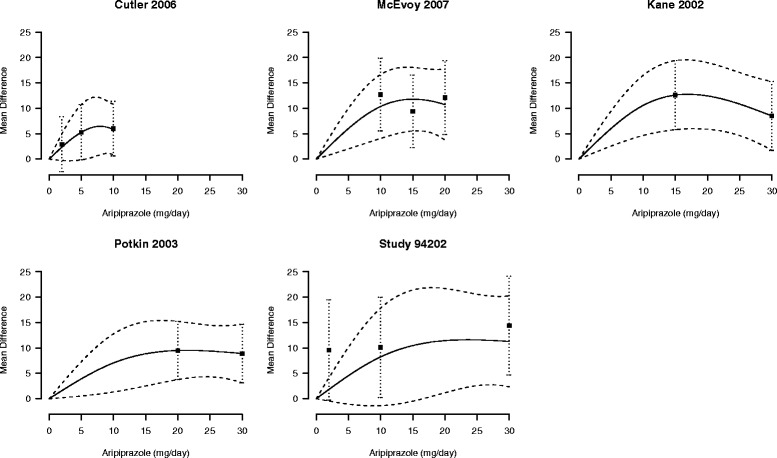
Study-specific mean differences in Positive and Negative Syndrome Scale score for increasing dosages of aripiprazole. The first author and year of publication of the subjects included in the original analyses are reported. Black squares indicate the mean differences and whiskers their 95 % confidence interval. Ariprazole dosage was modeled with restricted cubic splines. Solid lines represent the estimated dose-response curves, dashed lines the corresponding 95 % confidence intervals. The placebo group (dose = 0) served as the referent group