Fig. 5.

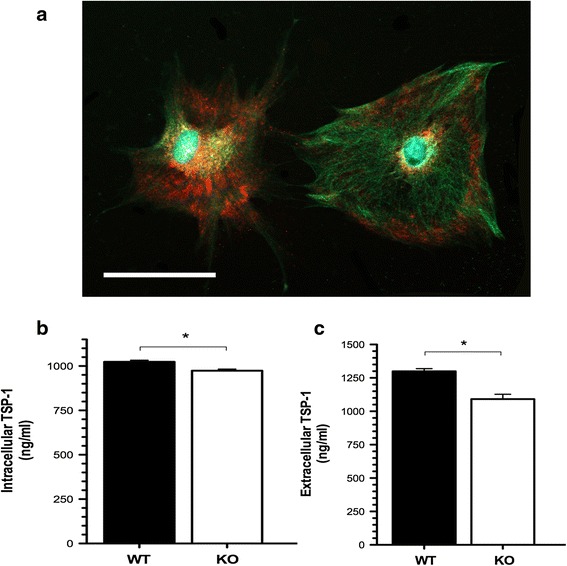
Reduced TSP-1 levels in cultured FXS cortical astrocytes. a Representative staining of cultured cortical astrocytes co-labeled with GFAP and TSP-1. At 7 DIV, the cells were fluorescently labeled with anti-GFAP (glial fibrillary acidic protein, green) to visualize astrocytes and anti-TSP-1 (thrombospondin-1, red) to identify the intracellular expression of TSP-1 using a 20× objective. Nuclei were counterstained with DAPI (blue). Cultured cortical astrocytes express abundant levels of TSP-1 at 7 DIV. Scale bars: 50 μm. b Quantification of intracellular TSP-1 protein levels by ELISA in cellular lysates. Fmr1 KO astrocytes express lower levels of cellular TSP-1 compared to their WT counterparts. c Quantification of extracellular secreted TSP-1 in astrocyte-conditioned media. Measurements in TSP-1 protein levels in ACM revealed marked reductions in secreted TSP-1 by Fmr1 KO astrocytes. Data was analyzed by Student’s t-test. Data are presented as the mean ± SEM, *p < 0.05; n = 5 cultures per genotype
