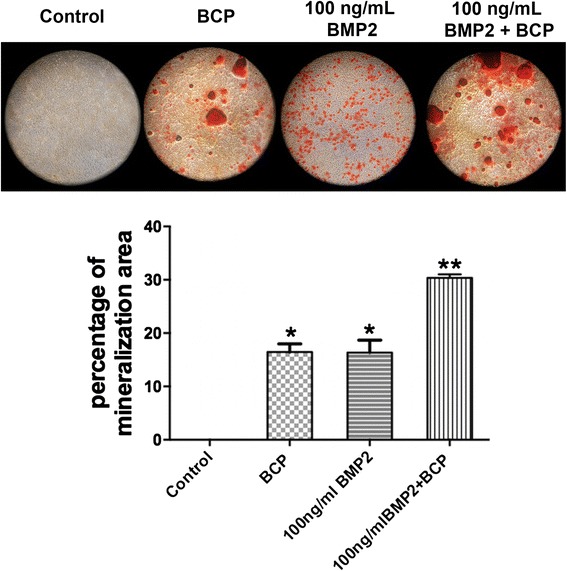
Fig. 5.

a Qualitative analysis of alizarin red staining to demonstrate areas of mineralization in MC3T3-E1 cells seeded on 1) control tissue culture plastic, 2) BCP alone, 3) 100 ng rhBMP2, and 4) 100 ng rhBMP2 + BCP at 14 days post seeding. b Percentage of mineralization area from alizarin red staining (* p < 0.05 denotes significant difference between group and control, ** p <0.05, denotes significantly higher than all other treatment)
