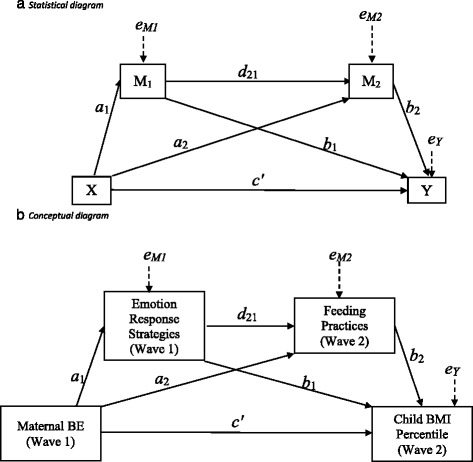
Fig. 2.

Statistical (Panel a) and conceptual (Panel b) diagrams of second hypothesis, in which maternal BE at Wave 1 (child age M = 37 months, SD = 6.94 months) predicts higher child BMI percentile at Wave 2 (child age M = 57 months, SD = 8.32 months) directly (c’), and indirectly through Emotion Response Strategies (a1b1), Feeding Practices (a2b2), and through both Emotion Responses and Feeding Practices (a1d21b2)
