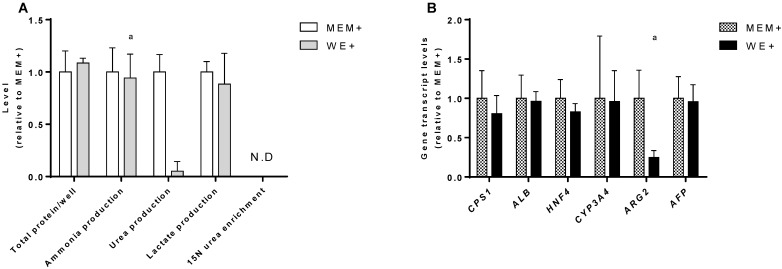
Figure 2.
C3A culture medium selection. Comparison of C3A cells in monolayers cultured in MEM+ or WE+ medium for 7 days. (A) Hepatic functions and total protein content normalized to MEM+ cultured cells. (B) Gene transcript levels relative to MEM+ cultured cells. N.D.= not detectable. a= p.<0.05 compared to MEM+.

