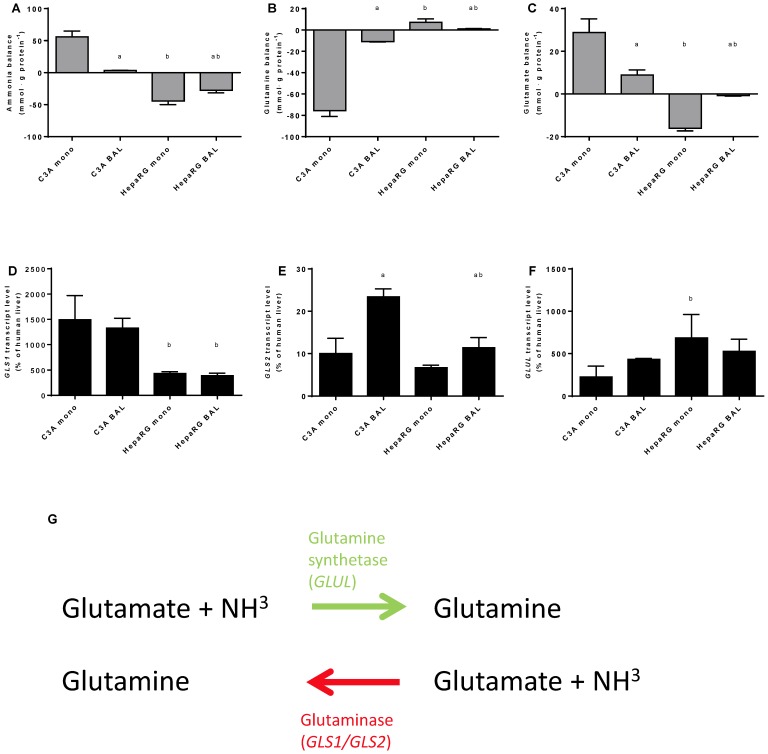
Figure 6.
Nitrogen balance. Comparison of HepaRG and C3A cultures in monolayers and BALs after 24 hours exposure to culture medium containing 1,5 mM of ammonia and 2 mM lactate for (A-C) ammonia, glutamine and glutamate balance, and for (D-F) transcript levels of GLS, GLS1 and GLUL. Diagram G illustrates the reversible conversion of glutamine into glutamate. a=p≤0.05 compared to same cell line in monolayer, b=p≤0.05 compared to C3A cells in the same culture platform.

