
Fig. 3.
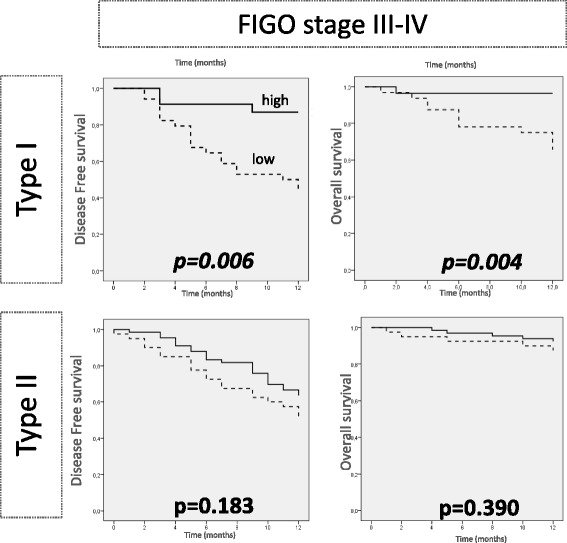
Survival curves limited to the first 12 months according to FOLR1 mRNA expression in type I and II cancers for FIGO stage III-IV. Kaplan-Mayer curves and log-rank test were applied. Cut off for FOLR1 expression: median values in the cancer cohort (9.14). Units: FOLR1 mRNA expression: arbitrary units normalized to TBP