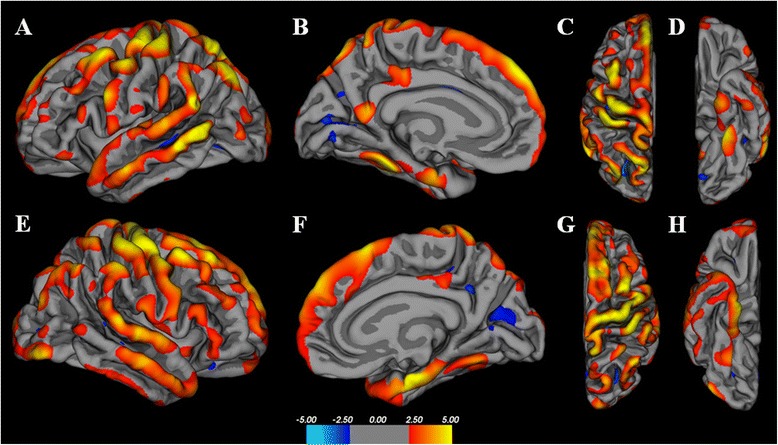
Fig. 1.

Whole-brain cortical thickness analysis of 11 ECD patients as compared to age-matched controls. Color maps represent statistical significance (t-statistic), with yellow representing the greatest statistical significance. Both cerebral hemispheres are represented in lateral projections (a,e), medial projections (b,f), superior (c,g), and inferior (d,h). The maps demonstrate diffuse and widespread regions of cortical volume loss with a predominance of the frontal and temporal lobes
