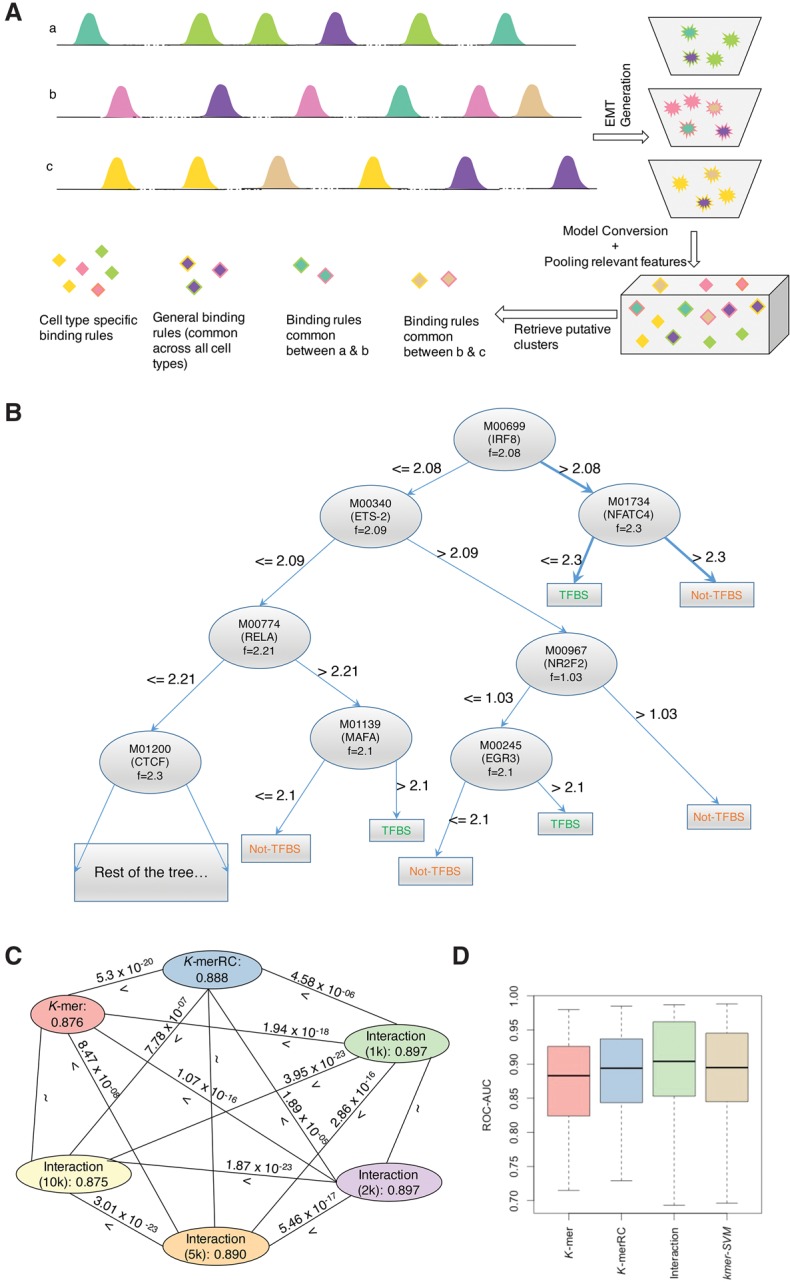
Figure 1.

(A) Schematic of TRISECT pipeline. Colors indicate different binding rules or submodels and rows (a–c) represent different cell types. Green, pink, and yellow colors indicate cell-type–specific submodels. Each ensemble model (EMT) is represented by a bucket of submodels (top right). Stars and diamonds with the same color denote corresponding submodels and data points after transformation into reduced feature space, respectively. Each submodel is represented by a decision tree. The submodels across cell types are clustered. Cyan is common between cell types a and b, light brown is common between cell types b and c, and purple is common across all three cell types. (B) An example submodel taken from the Interaction model for CEBPB-GM12878. Each node in the tree is labeled with the TRANSFAC id, corresponding gene name, and the threshold at which the feature is split. Two binding rules are highlighted indicating TF binding and no TF binding. (C,D) Same color is used to denote the models using the same features. (C) Comparison of accuracy between all pairs of feature sets. Nodes are labeled with feature type and mean accuracy. Edges are labeled with “>” (greater) or “<” (less) sign and two-sided Wilcoxon P-value. (D) Accuracy (ROC-AUC) distribution of EMT for K-mer/K-merRC/Interaction (1 k) and those of kmer-SVM models.
