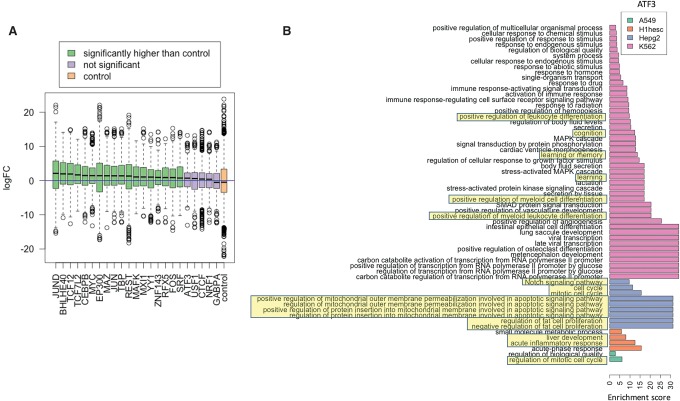
Figure 5.
Functional validation of putative cofactors. (A) Each boxplot corresponds to all cofactors of a TF on the x-axis, and the y-axis denotes the log fold change (logFC) of the expression of cofactors in cell types where it is identified as a cofactor (i.e., relevant cells) versus cell types where it is not. The “blue” horizontal line at Y = 0 denotes no fold change. For a TF motif detected as a cofactor in n cell lines, and not in another m cell lines, we calculated log fold change (logFC) in the TF's expression between the two sets of cell lines. Identified cofactors have higher expression in the cell lines they are detected in (relevant cells). (B) Enrichment scores of GO terms obtained from GO analysis of cofactors in four cell types of ATF3 (selected arbitrarily). The known cell-type–specific biological roles are highlighted.

