
Fig. 3.
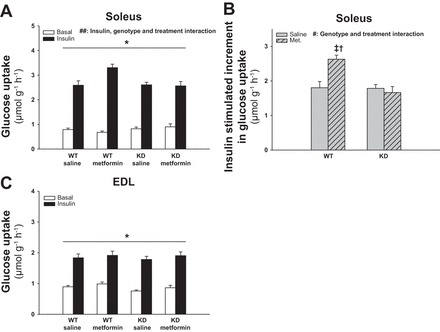
Effect of chronic metformin treatment on glucose uptake in soleus and EDL muscles from WT and AMPK KD mice. Filled and open bars represent results from muscles incubated with or without insulin (10,000 μU/ml), respectively (A and C). Gray bars without and with hatches show results from saline- and metformin-treated mice respectively (B). A: basal and insulin-stimulated glucose uptake in soleus muscles from metformin- or saline-treated WT and AMPK KD mice. B: Δ values (insulin-basal) of insulin-stimulated glucose uptake in soleus muscles from metformin- or saline-treated WT and AMPK KD mice. C: basal and insulin-stimulated glucose uptake in EDL muscles from metformin- or saline-treated WT and AMPK KD mice. *Significant difference between basal and insulin-stimulated glucose uptake (main effect, P < 0.01); †significant difference on insulin-stimulated glucose uptake between interventions in WT mice (P < 0.01); ‡significant difference between genotypes treated with metformin (P < 0.01); #significant interaction between genotype and treatment (P < 0.01); ##significant interaction between insulin, genotype, and treatment (P < 0.01); n = 12–13. Values are means ± SE.