
Fig. 6.
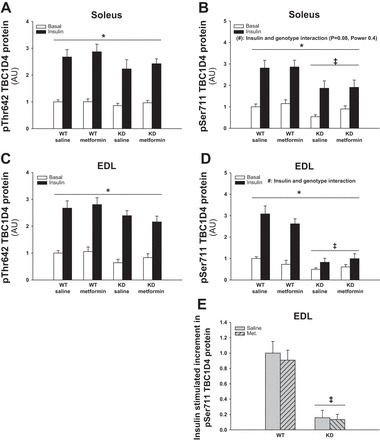
Effect of chronic metformin treatment on TBC1D4 Thr642 and Ser711 phosphorylations in soleus and EDL muscles from WT and AMPK KD mice. Filled and open bars represent results from muscles incubated with or without insulin (10,000 μU/ml), respectively (A–D). Gray bars without and with hatches show results from saline- and metformin-treated mice, respectively (E). A: Thr642 phosphorylation in basal and insulin-stimulated soleus muscles from metformin- or saline-treated WT and AMPK KD mice. B: Ser711 phosphorylation in basal and insulin-stimulated soleus muscles from metformin- or saline-treated WT and AMPK KD mice. C: Thr642 phosphorylation in basal and insulin-stimulated EDL muscles from metformin- or saline-treated WT and AMPK KD mice. D: Ser711 phosphorylation in basal and insulin-stimulated EDL muscles from metformin- or saline-treated WT and AMPK KD mice. E: Δ values (insulin-basal) of insulin-stimulated Ser711 phosphorylation in EDL muscles from metformin- or saline-treated WT mice. *Significant difference between basal and insulin-stimulated TBC1D4 phosphorylation (main effect, P < 0.01); ‡significant difference between genotypes (main effect, P < 0.01); #interaction between insulin and genotype (P < 0.01); (#)tendency for an interaction between insulin and genotype (P = 0.08, power = 0.4); n = 10. Values are means ± SE.