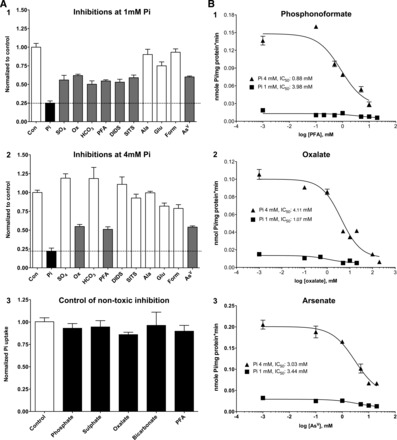
Fig. 6.

Pattern of Pi transport inhibition. A: normalized graphs of Pi uptake inhibition with several substrates. 32Pi uptake was assayed at 50 μM for 20 min. Solid and shaded bars indicate significant (complete or partial, respectively) inhibition compared with the control (Con; open bars). Pi, phosphonoformic acid (PFA), and arsenate (AsV) were used at 5 mM; alanine (Ala), glutamate (Glu), formate (Form), sulfate (SO4), oxalate (Ox), and carbonate (HCO3) were used at 10 mM; DIDS and SITS were used at 0.1 mM. The dashed line indicates the level of inhibition with 5 mM Pi as an inhibitor. A: effect on 1 mM Pi-maintained Caco2BBE cells (1), effect on 4 mM Pi-preincubated Caco2BBE cells (2), and absence of metabolic/toxic effects of the inhibitors after 20 min of preincubation in the absence of 32Pi (3). B: dose-response relationships of the indicated inhibitors using Caco2BBE cells incubated with 1 or 4 mM Pi. The corresponding mean inhibitory concentrations are indicated.
