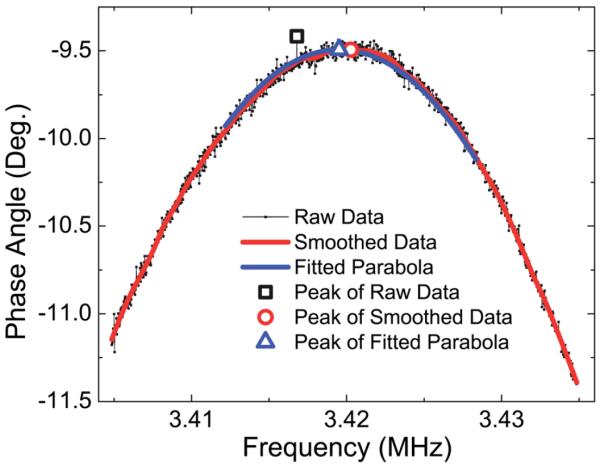
Fig. 3.

Phase angle versus frequency resonance spectra where the raw data and the smoothed data are represented by the black full squares and the red curve, respectively, a parabola fitting using 540 data points is shown as the blue curve. The peak position of the raw data, that of the smoothed data and that of the fitted parabola are shown as the large black full square, red full circle and blue triangle, respectively.
