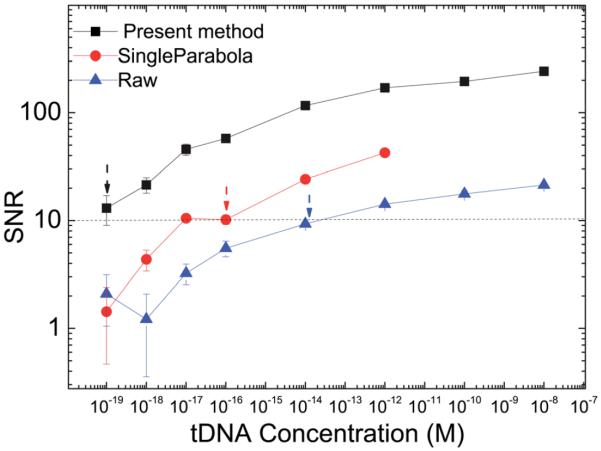
Fig. 6.
Signal to noise ratio (SNR) versus tDNA concentration of tDNA detection in PBS by PEPS A where full squares, full circles, and full triangles denote SNRs obtained by the present multiple-parabola fitting algorithm, by single-parabola fitting (red circles), and by raw data, respectively. Arrows indicate the lowest concentrations with an SNR value of 10 for each method.

