
Fig. 3.
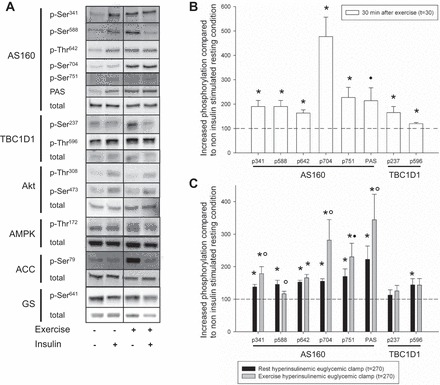
Effect of 1 h ergometer cycling at 65% V̇o2 peak (exercise) on signaling to GLUT4 translocation was assessed with Western blotting. A: representative blots of phosphorylated and total protein expression of AS160, TBC1D1, AMPK, ACC, Akt, and glycogen synthase after an overnight fast (rest) and after exercise during noninsulin-stimulated and insulin-stimulated conditions. B: open bars indicate increase in site-specific phosphorylation 30 min after exercise compared with time-matched nonexercised control condition (dashed line) on AS160 and TBC1D1. All site-specific phosphorylations increased after exercise (*P < 0.05), whereas the nonspecific phosphorylation detected with the PAS antibody revealed a trend for only an increase compared with resting condition at 30 min (●P = 0.068). Standard errors for site-specific AS160 and TBC1D1 phosphorylation in resting condition at 30 min were: AS160 p-Ser341 = 11.60, p-Ser588 = 8.34, p-Thr642 = 5.05, p-Ser704 = 10.30, p-Ser751 = 10.36, PAS = 22.02, and TBC1D1 p-Ser237 = 12.95, p-Thr596 = 14.26. Presented protein phosphorylations are expressed as a ratio of total protein expression. C: solid and shaded bars indicate increase in site-specific phosphorylation during insulin stimulation (t = 270) compared with resting condition at 30 min (dashed line) during resting and postexercise conditions, respectively. Phosphorylation on all AS160 sites and TBC1D1 Thr596 was increased by insulin stimulation at 270 min compared with without insulin at 30 min on the resting day (*P < 0.05). Insulin-induced phosphorylation was augmented by exercise on Ser341, Ser704, and PAS (○P < 0.05) at 270 min compared with time-matched nonexercised control condition, and a trend was observed on Ser751 (●P = 0.072). No additional exercise effect was seen on AS160 Thr642 at 270 min compared with time-matched nonexercised control condition, and no insulin effect was observed on Ser588 after exercise at 270 min compared with without insulin at 30 min on the resting day. Presented protein phosphorylations are expressed as a ratio of total protein expression.