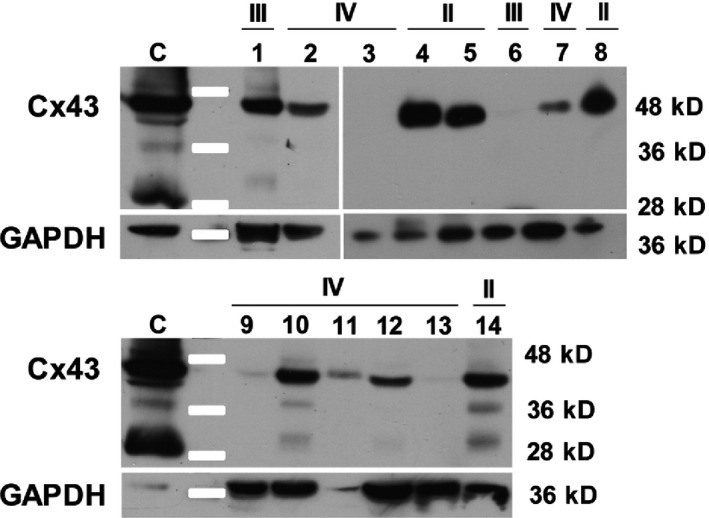
Figure 4.

Western blot showing the variability in Cx43 expression in human gliomas. Within grade II tumors (4, 5, 8, 14), Cx43 was detected in every sample at the expected size (43 kD). Within grade III tumors (1, 6), Cx43 was shown in only one of the two samples. In grade IV tumors (2, 3, 7, 9–13), two samples out of eight did not express Cx43 at a detectable level. (C) Rat C6 glioma cell line expressing a high level of Cx43, used as a positive control. In some samples (1, 10, 14), Cx43 antibody allowed the detection of another band (25 kDa) that was also observed in the control. Moreover, in some of these samples (10, 14), a third band (35 kDa) was clearly seen as in the control (C).
