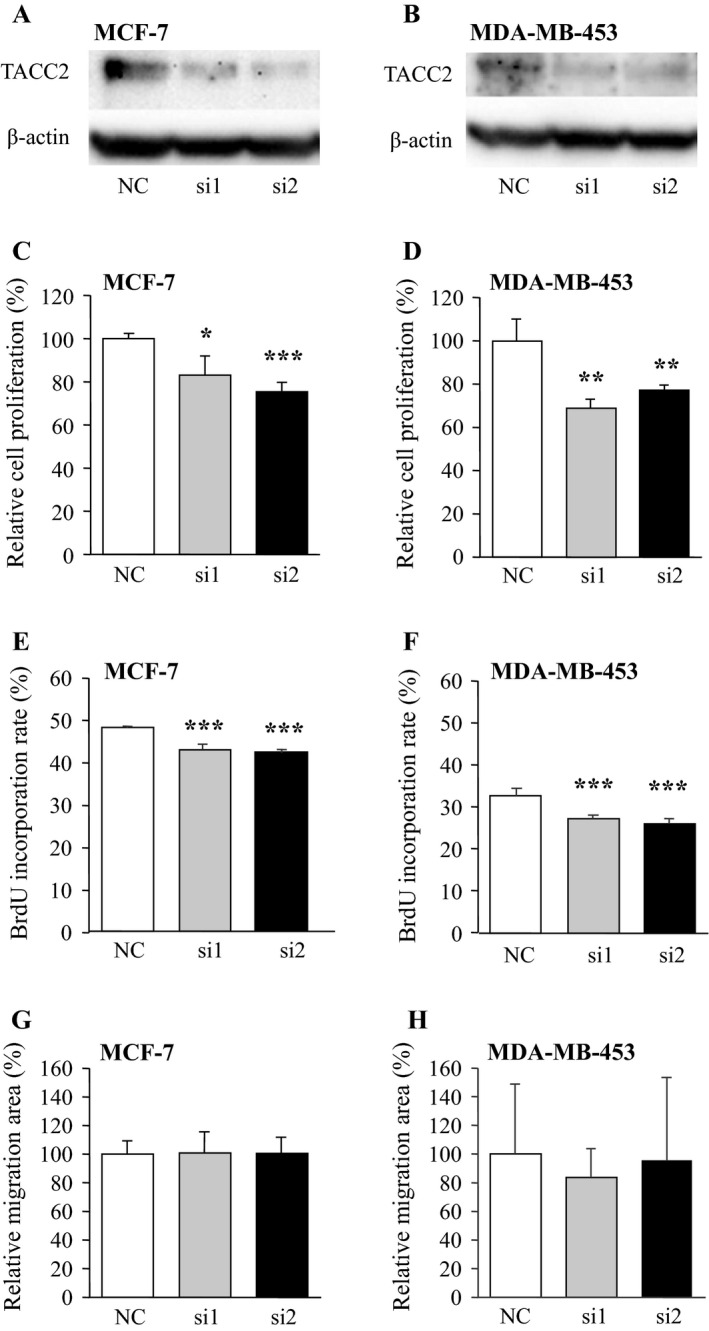
Figure 3.

Effects of TACC2 on cell proliferation and invasion in breast carcinoma cells. (A, B) Protein expression of TACC2 major isoform in MCF‐7 (A) and MDA‐MB‐453 (B) cells transfected with TACC2‐specific siRNA (si1 and si2) or negative control siRNA (NC). In the immunoblotting, 10 μg of protein was loaded in each lane, and β‐actin immunoreactivity was shown as the internal control. (C, D) Proliferation activity of MCF‐7 (C) and MDA‐MB‐453 (D) cells transfected with siRNA summarized as a ratio (%) compared to that at 0 day after treatment. (E, F)Percentage of BrdU incorporated cells in the MCF‐7 (E) and MDA‐MB‐453 (F). (G, H) Wound‐healing assays in MCF‐7 and MDA‐MB‐453 cells. The relative migration area was evaluated as a ratio (%) compared to the control cells (left bar). Open bar: NC, gray bar: si1; and closed bar: si2. Data are presented as the mean ±S.D. (n = 3), respectively. *P < 0.05, **P < 0.01, and ***P < 0.001 compared with negative control group (left bar). The statistical analyses were performed using one‐way ANOVA and Fisher's protected least significant difference.
