Figure 3.

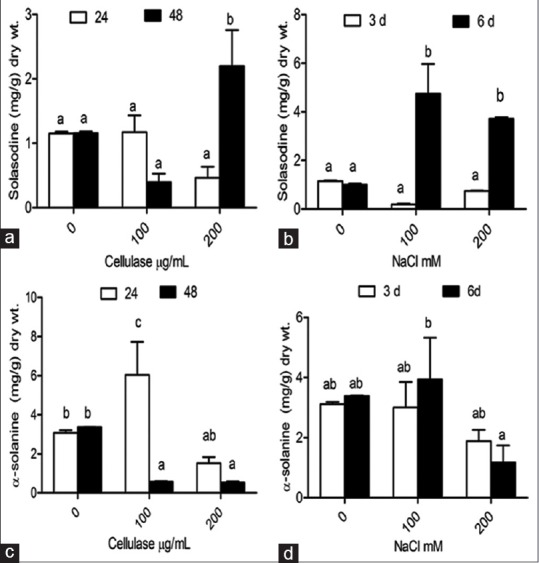
Solasodine and α-solanine content in hairy roots of Solanum khasianum. (a and c) 0 μg/mL, 100 μg/mL and 200 μg/mL concentration of cellulase treatment; (b and d) 0 mM, 100 mM and 200 mM NaCl concentration respectively

Solasodine and α-solanine content in hairy roots of Solanum khasianum. (a and c) 0 μg/mL, 100 μg/mL and 200 μg/mL concentration of cellulase treatment; (b and d) 0 mM, 100 mM and 200 mM NaCl concentration respectively