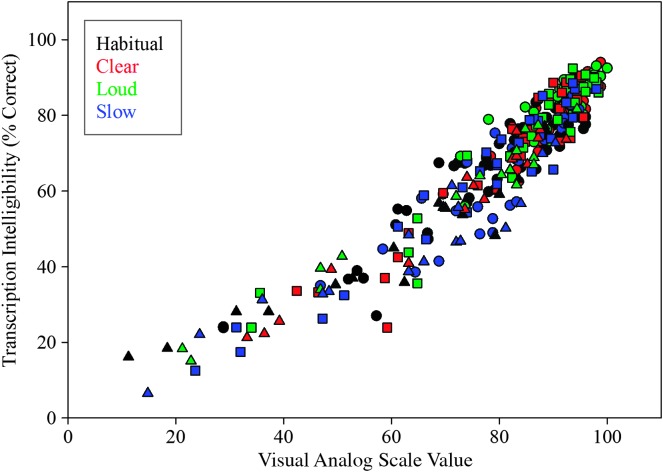
Figure 2.
Percent correct transcription scores versus visual analog scale scores for each speaker in each condition (each point on the graph represents a single speaker in a given condition). Speaker group is designated by symbol shape, and condition is designated by symbol color. Control = circles, multiple sclerosis = squares, and Parkinson's disease = triangles.

