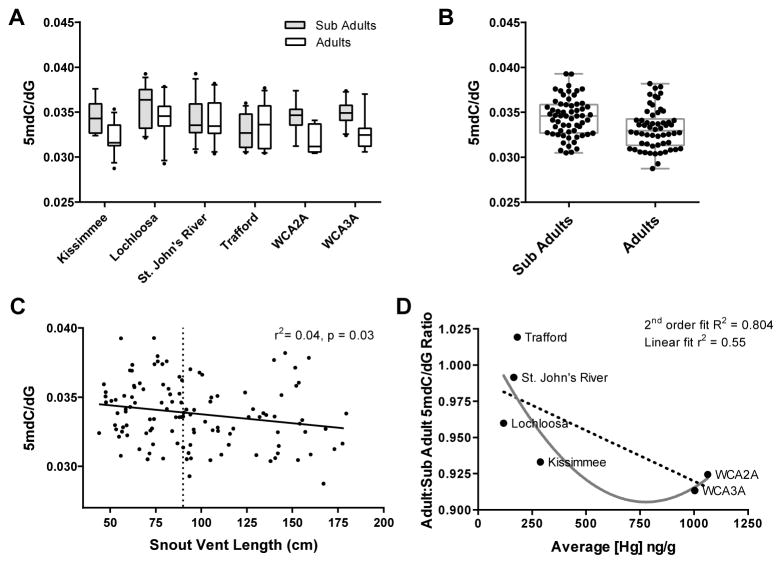
Figure 3.
Influence of site and size class (age) on global measures of DNA methylation in the American alligators (Alligator mississippiensis) sampled in Florida using whole blood (THg analysis) and red blood cells (DNA methylation analysis). (A) Box-and-whisker plots of global DNA methylation measures across site and age class. (B) Across all individuals, sub adults have greater measures of global DNA methylation when compared to adults. (C) Snout-vent length is plotted against 5mdC/dG for each individual. Results of a linear regression analysis is reported, dotted line demarcates the sub-adults and adults. (D) The proportion of global DNA methylation in adults relative to sub-adults from the same site is plotted against the mean concentrations of THg measured for each site. r2 values are reported for linear regression analyses; R2 values are reported for non-linear regression analyses.

