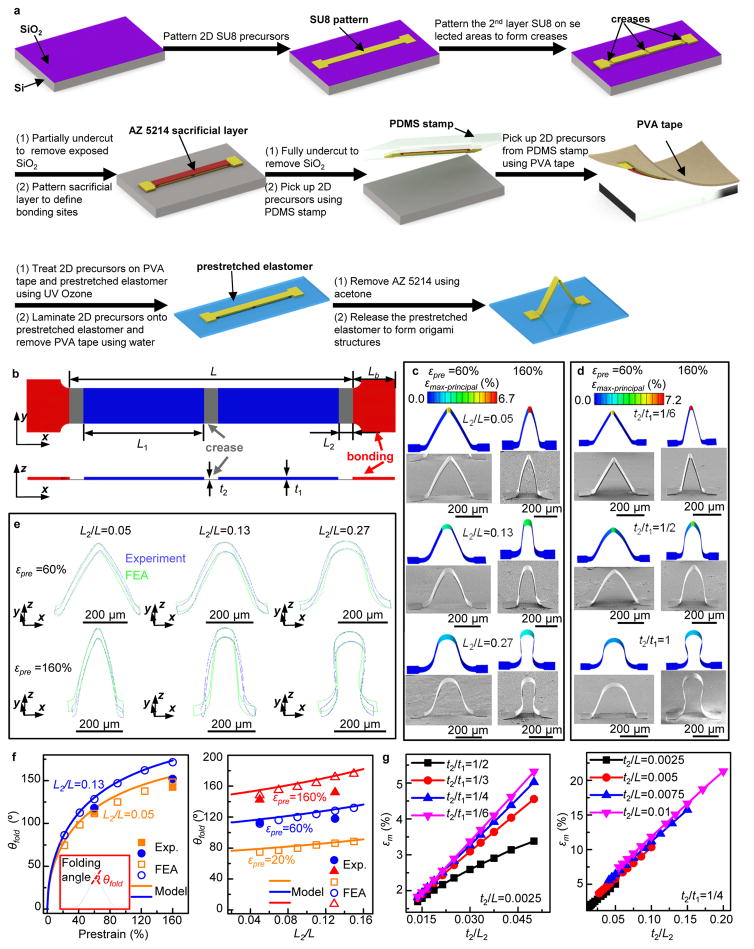
Figure 1. Conceptual illustration of buckling guided origami.
(a) Schematic illustration of steps for fabricating 3D origami polymer (SU8) structures. (b) Top and cross-sectional views of a straight ribbon with two different thicknesses. FEA results and corresponding SEM images of deformed mesostructures consisting of bilayers of metal (Au) and polymer (SU8) under two different levels (60% and 160%) of prestrain, for the non-uniform ribbons (c) with a fixed thickness ratio (t2/t1 = 1/4) and three different length ratios (L2/L), or (d) with a fixed length ratio (L2/L = 0.05) and three different thickness ratios (t2/t1). (e) Borderlines of the deformed configurations for the mesostructures in (b), where the curves in green and blue correspond to results based on FEA and SEM images, respectively. (f) Folding angle (θfold) versus the prestrain (left) for a straight ribbon with a fixed Lb/L = 0.15 and two different length ratios, and versus the length ratio (right) for a straight ribbon with a fixed Lb/L = 0.15 and three different prestrains. (g) Maximum material strain versus the normalized thickness (t2/L2) of a straight ribbon (b) under compression with 60% prestrain, for a fixed t2/L = 0.0025 with a range of t2/t1 (left), and a fixed t2/t1 = 1/4 with a range of t2/L (right). In Figure 1c,d, the color in the FEA results corresponds to the magnitude of maximum principal strain. Scale bars, 200 μm.

